
View the PDF here.
The supply chain of pharmaceuticals consumed in the US has become reliant on foreign sources of drug products and intermediates over the last two decades. Growth of generics and biosimilars has driven firms to reduce labor costs, which has led to China and India leading much of upstream supply. In response, the White House has announced a series of funded initiatives aimed at improving the US’s domestic market share, creating “good jobs,” and reducing supply chain risk.
However, our analysis of the pharmaceutical manufacturing industry suggests that the sum total of the White House’s investments will be a “drop in the bucket” compared to their respective market sizes. Strong economic headwinds continue to drive manufacturers out of the US, including shifts in overall product mix, geographic concentration of key starting materials (KSMs), and the availability of human capital in the life sciences.
More likely, private industry will determine where the future of biomanufacturing lies. So where can domestic manufacturers vie for share? The White House initiatives bring up a key strategic decision at the core of this question: Is the optimal path forward one of repatriation back to the US? Or is futureproofing US innovations from offshoring a better strategy? The latter holds promise for a defendable US stake, especially in new and innovative modalities, but will require an uptick in the supply of qualified life sciences talent to fill these high-skill manufacturing roles.
The state of the supply chain
Whether or not we think of it as a national security threat, pharmaceutical manufacturing strategy is top of mind for many concerned with US resiliency to global geopolitical instability. For years, the US government belabored an increasingly foreign-dependent supply of medicines, citing the growing shares of China and India as major vulnerabilities. Beyond capture of a share of past domestic jobs and GDP, international shipping and production disruptions since 2020 have led to more frequent drug shortages in the US healthcare system. The recent pandemic only highlighted how ill-suited this system is to rapid changes in demand—leading to buy-outs of the entire global supply of an early COVID-19 treatment (remdesivir, aka Velkury®) by the US government.[1]
Recent political attention has culminated in a White House initiative[2] which pledges $2B over 5 years to “create good jobs and strengthen supply chains.”
The initiative emphasizes a strengthening of domestic production of pharmaceuticals, from key starting materials (KSM) and active pharmaceutical ingredients (APIs) all the way through finished dosage forms (FDFs). See Appendix for more detail on the stages of the supply chain. The initiative is quite broad—and frankly bold—in scope, so we distilled it into three core objectives and took a deeper look at the economic headwinds that each would have to overcome in order to make a dent in preeminent supply chain trends.
Objective 1: Expand domestic biomanufacturing
In the early-to-mid 2010s, roughly half of all US-consumed pharmaceuticals (by value) were generated domestically; that’s no longer the case. Since the mid-2010s, total US value-add (the sum of FDFs prepared from commodity materials domestically, plus the value created in making FDFs from imported KSMs and/or APIs) has stagnated, even falling slightly, since 2017. In its place, imported products have fueled the ever-growing US pharmaceutical market. See Figure 1 and Appendix B for notes on methodology.

Figure 1. Annual consumption value of US pharmaceutical imports rises while domestic value-add stagnant since mid-2010s
To address the stagnant ~$250B in domestic value-added, the DoD has announced an investment of $200M/yr over 5 years to “catalyze the establishment of the domestic bio industrial manufacturing base” with emphasis on insourcing “critical chemicals.” That investment amounts to about 1% of current US API imports (equally minute compared to US capacity investments by commercial firms, which we’ll discuss later).
Objective 2: Create good jobs
Pharmaceutical manufacturing supports 325,000 jobs in the US—with ~126,000 directly involved in physical production or engineering and another ~44,000 life science roles—and they pay well.[3] With average salaries of $126K, they surpass the average of US STEM grads ($114K) and nearly double the average for non-pharma US private sector ($68K).[4] The same is true even within a specific occupation class; for instance, a typical production-line inspector/weigher will earn 16% (~$7K/yr) more in pharmaceutical manufacturing than in other industries with the same job title.[5]
These are certainly “good domestic jobs,” but the number of them has been roughly the same since 2000; growth has stagnated at just 1%/year, well behind the 7%/year growth of in total pharmaceutical manufacturing demand.[6] Some of that disparity is due to labor productivity gains and automation. However, when we map out US pharmaceutical manufacturing labor productivity (measured as the number of commercially active and pipeline drugs in the US per 10K domestic employees) and compare against global labor productivity measured the same way, a significant gap emerges. See below.
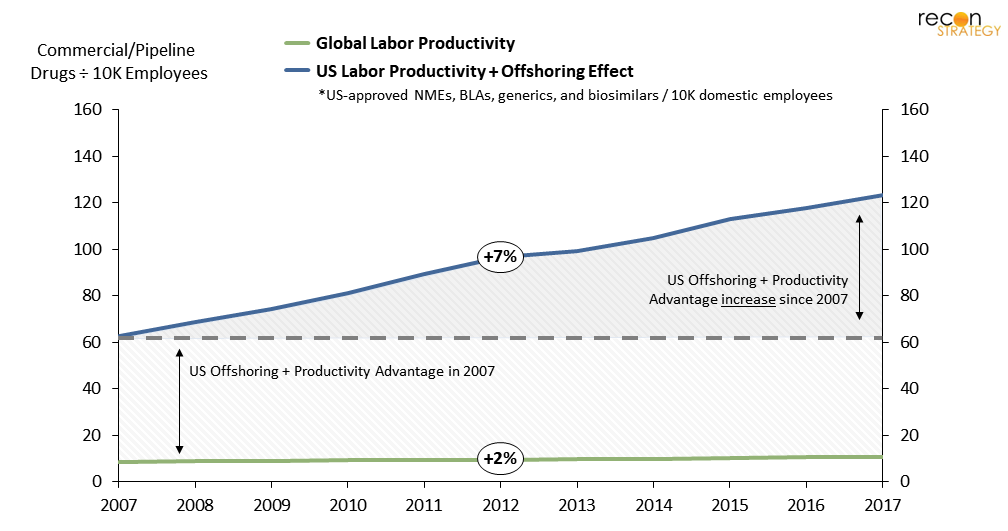
Figure 2. Offshoring of jobs is likely the primary cause of the increasing US domestic-labor productivity curve
In 2007, US pharmaceutical “domestic labor productivity” (the ratio of US-consumed drugs per the size of our domestic manufacturing workforce, a metric which is inherently inflated by the offshoring of jobs) was 6 times higher than “global labor productivity” (the ratio of globally-consumed drugs per the size of the global manufacturing workforce, in which offshoring is factored out). That difference has since doubled to 12 times higher in 2017.
While changes to product and labor mix must play a partial role, the data is strongly suggestive of significant, and rapidly increasing, offshoring. As a result, the US has essentially doubled the number of drugs (commercial and pipeline) consumed domestically without a significant increase in its domestic workforce.
Bolstering our domestic workforce is a key component to increasing manufacturing capacity and expanding capabilities.[7] As such, it is also imperative not just to have a trained workforce, but one that is capable in a diverse range of technologies. Yet the extent to which the White House initiative addresses workforce growth culminates in a $68M NIH program to “train the next-generation of biotechnologists.” For comparison, just the largest 50 pharmaceutical manufacturing facilities in the US have an annual payroll of roughly $6B (granted, $68M in graduate student stipends could translate into a few hundred million dollars in end salaries).[8]
Objective 3: Improve supply chain resiliency
It’s well known that most upstream ingredients for pharmaceuticals are manufactured outside the US (73% of API manufacturing facilities).[9] Nearly all critical antibiotics, for instance, originate from foreign sources: ~2/3 of which being in Asia.[10]
However, since many upstream processes and materials are “pre-GMP,” documentation requirements are much lower. Thus, these processes lack systematic tracking data, which only adds to general weariness about supply chain vulnerability. The United States Pharmacopeia (USP), which provides quality standards for manufacturers, has launched a “Medicine Supply Map,”[11] which identifies the production sites of 92%+ of FDA-approved generic medicines, by both FDFs and component APIs. The tool provides visibility into the specific source of each API/FDF lot. The next step, mapping the key starting materials origins for each API lot, is sure to be an order of magnitude more complex and will require substantial investment.

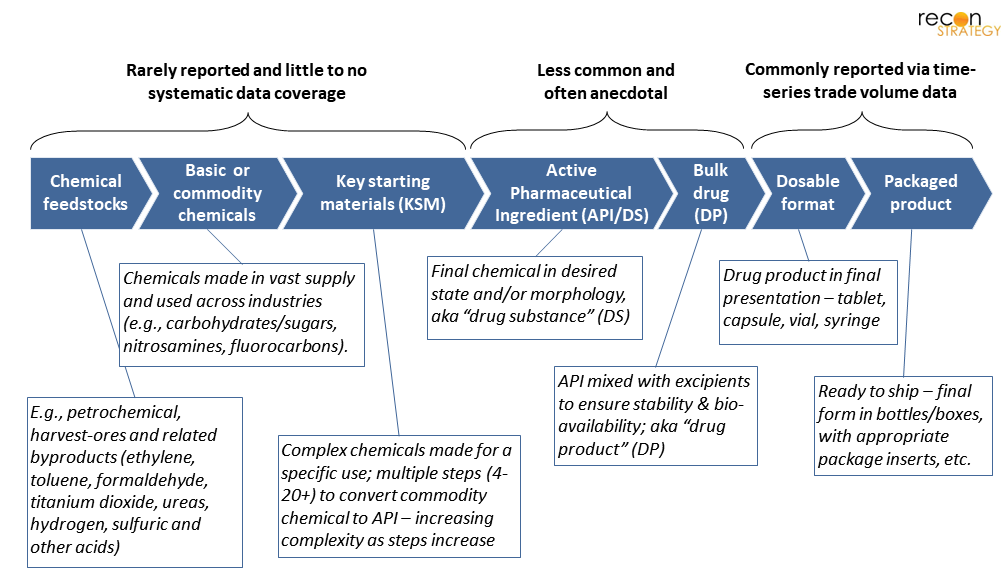
Figure 3. Manufacturing stages and their relative value/complexity by drug type. *Most steps are low value-add, but there are cases where complex technology is used, adding high-value.[12]
Intuitively, though, many commodity chemicals, KSMs, and even APIs are produced in the same country (or among trade-treaty partners) when possible; this simplifies supply-chain logistics, minimizes shipping (especially for volatile, flammable, or unstable chemicals[13]), and may maintain operations under consistent regulatory oversight. Commonly, APIs are manufactured entirely within China and then shipped to India (~70% of their API imports)[14] to be completed as an FDF, which is then finally shipped into the US (which is ~40% of US imported generic drugs).
The White House initiative attempts to directly address this challenge with a $40M HHS investment to “expand the role of biomanufacturing for [APIs], antibiotics, and the key starting materials needed to produce essential medicines.” That’s about 1.6% the value of APIs imported from China alone, and 0.2% the value of all US API imports.
Even if the government were to invest a larger amount to improve our domestic share of API manufacturing, though, it may not actually drive most of our supply chain vulnerabilities.
Since 2010, the dollar-value of annual APIs imports has decreased, despite an increase in weight. This implies a mix shift towards cheaper materials, largely being supplied by China (though a few high-value items, from the EU, represent the majority of value).

Figure 4. US pharmaceutical imports have grown 7%/yr overall since 2010, but that differs by exporter and by product
On the other hand, the value of imported FDFs, in which the US has ceded the valuable step of API-to-FDF conversion to another region, has grown 9% per year. In terms of value creation opportunities for US manufacturers—and as a direct result, payroll—it’s these FDFs where the US is losing the most. This change is one of the most consequential drivers of domestic manufacturing stagnancy and greater reliance on foreign sources in the last decade.
Another important consideration for how we approach supply chain resiliency is whether we are more concerned about value or volume. Most high-value drugs are lower volume, with fewer associated manufacturing jobs (though likely requiring some of the highest-paid skills). However, if we want to ensure drug-supply for as many Americans as possible, we would look to volume. Most high-volume drugs are lower in value.
If our perspective is on value, then our greatest sources of international reliance are Ireland, Switzerland, and Germany. However, if we’re more concerned about volume, then China and India begin to come into the forefront. While the HHS names no specific countries in their announcement, this bifurcation of priorities will no doubt be a critical consideration when it comes to this next year’s implementation.
All that said, will any of these White House initiatives actually make a dent in the current state of the supply chain? When we compare the total amount (per year) of investment against the corresponding addressable markets—admittedly, a slightly unfair comparison—it doesn’t bode well. Even a fractional change in the market would require an ROI from these investments of several multiples.
Perhaps even more striking: the total of this government funding for drug manufacturing is only slightly larger than the Series D financing of Resilience, a US-based contract drug manufacturer launched in 2020.[15]
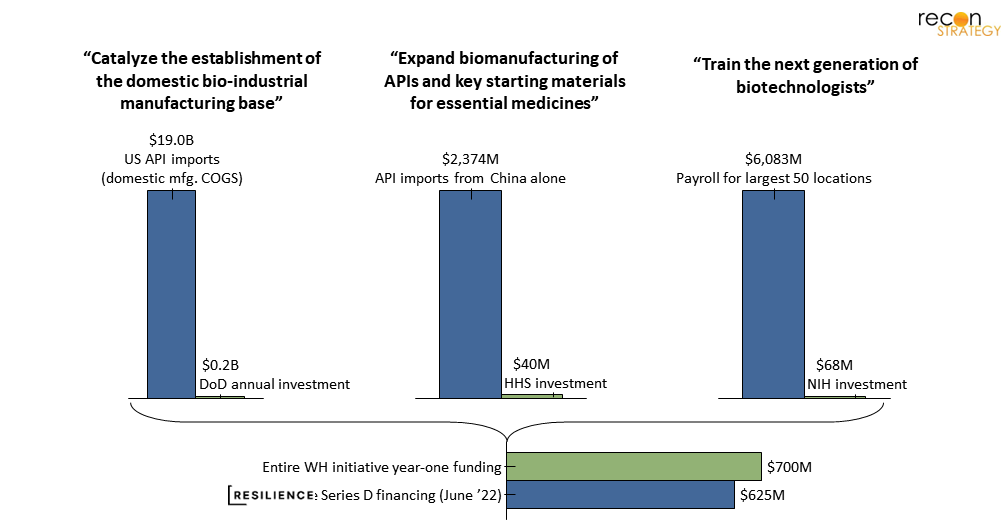
Figure 5. Real change is likely going to be driven by private industry – White House funding is marginal
Of course, raw investments aren’t the only lever the government has at its disposal here, nor is it likely the strongest; the power of the administrative state may be a significant factor. Though pharmaceuticals have largely been exempted thus far, new protectionist trade regulations in other industries (e.g., Bureau of Industry and Security’s semiconductor export controls on China[16]) are certain to generate discussions in corporate boardrooms on the future of manufacturing in China. Add in the jurisdiction of the FDA’s inspection regime, and the US has a readily available tool to adjust its stringency when it comes to offshore manufacturing.
That said, similarly strict regulatory bans are more unlikely for pharmaceuticals. The US market has become so reliant on offshore manufacturing that any such trade regulations risk massive drug-supply shortages, particularly for essential medicines. Simply, the US can’t produce enough domestically to make this jump overnight—further investments in US-based capacity and human capital will be prerequisites.
More generally, drug manufacturers make million (and billion) dollar investment decisions on new manufacturing sites each month. Some recent examples include: J&J and Legend’s $500M investment for a CAR-T production site in New Jersey, Lilly’s $2.1B funding for two new sites devoted to API and genetic medicines in Indiana.[17] This isn’t even considering the growth of contract development and manufacturing organizations (CDMOs) which have also built significant US-sited capacity in recent years.[18] It strikes us that, from a raw investment power perspective, it’s far more likely that private industry players will be the ones to drive the future of domestic manufacturing and, importantly, determine the shape of that future—such as the specific modalities to produce.
What might that look like?
Drivers that industry will need to think about strategically
One of the foremost factors to consider is the shifting product mix. Generics and biosimilars are driving a majority of current supply chain growth—about 62% of newly commercial drugs in the world since 2010.
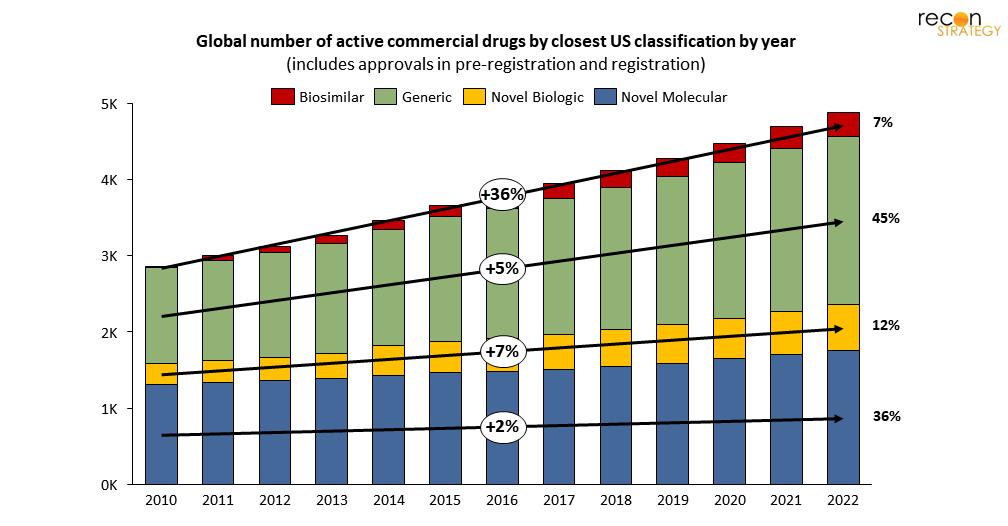
Figure 6. Generics and biosimilars are driving most new growth in pharmaceutical manufacturing demand
These “copy-cat” products have an entirely different cost structure than that of novel drugs: minimal (if any) development cost, greater competition, and lower prices and tighter margins (in the US, at least[19]).
Unsurprisingly, we see a disproportionate share of generics and biosimilars manufactured in Asia where comparable human capital is cheaper (especially in China and India), not to mention the different capital cost structure for production facilities build. Of course, this statistic comes with a massive caveat: volume is not proportional to value. As noted before, drugs coming from the EU are typically more expensive per dose than those coming from China and India.
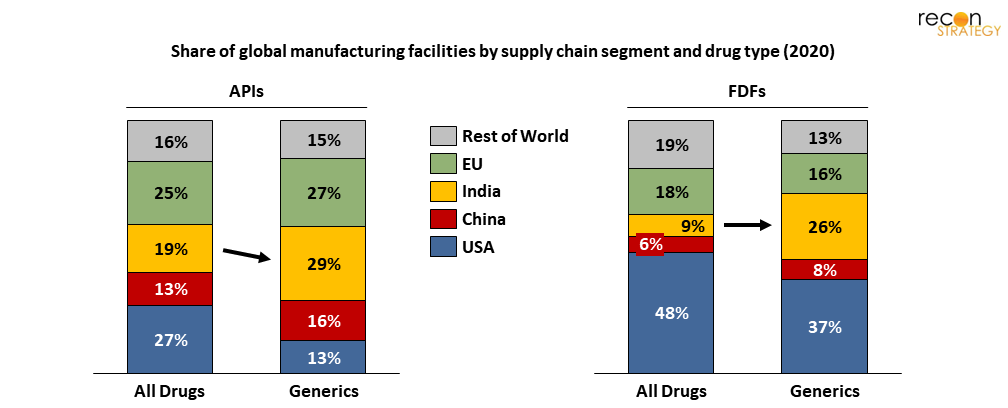
Figure 7. India represents a disproportionately large share of generics manufacturing capacity
The cost structure of generics/biosimilars makes them inherently tougher targets for repatriation, and frankly a bit counterproductive to the objective of “creating good jobs.” Even if US manufacturers could financially justify domestic production, the jobs they would bring are, by nature, wage constrained.
The opposite could be said of expensive brand-name FDFs, many of which are currently imported from the EU (despite many of those manufacturers having US roots).
Higher margins, as well as newer technologies and modalities, correspond to higher paid labor and greater expertise. From a “good jobs” perspective, repatriation of these products offers “more bang for your buck.” Looking across three distinct therapeutic classes is illustrative of the range of challenges and opportunities.
First, consider immunology and cancer products. These drugs account for 36% of total US FDF import value, yet only 2% of total shipment weight. Most of these products leverage newer technologies and drive high-paying jobs (albeit limited in numbers).
Moreover, the value of immunology and cancer imports today is has grown to 8 times greater than it was in 2010 (over the same period, shipment weight only doubled, which suggests a parallel shift in either pricing and/or effective dose…). Most of that growth has been concentrated in just a handful of EU countries and Switzerland.
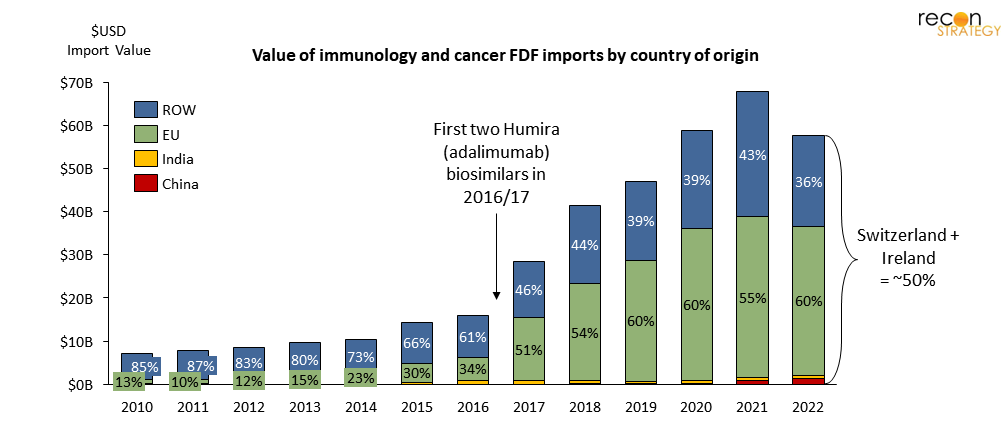
Figure 8. Immunology and cancer FDF imports have grown 8x in value since 2010, mostly from Switzerland and Ireland
Next, we consider a high-volume therapeutic class: cardiovascular[20] drugs (while an older product-portfolio with many generics, arguably some of the most powerful in terms of human impact). These drugs represent 40% of total import shipment weight (perhaps unsurprising given that almost half of US adults have some form of cardiovascular disease) despite only accounting for 7% of import value. Unlike immunology and cancer products, many of the largest CVD generic FDFs are manufactured in India (including ezetimibe, rosuvastatin, metoprolol, and clopidogrel).[21] The supply chain for this therapeutic class of products is actually one of the most diversified: India, Germany, and Switzerland combined represent just 44% of imports (see below).
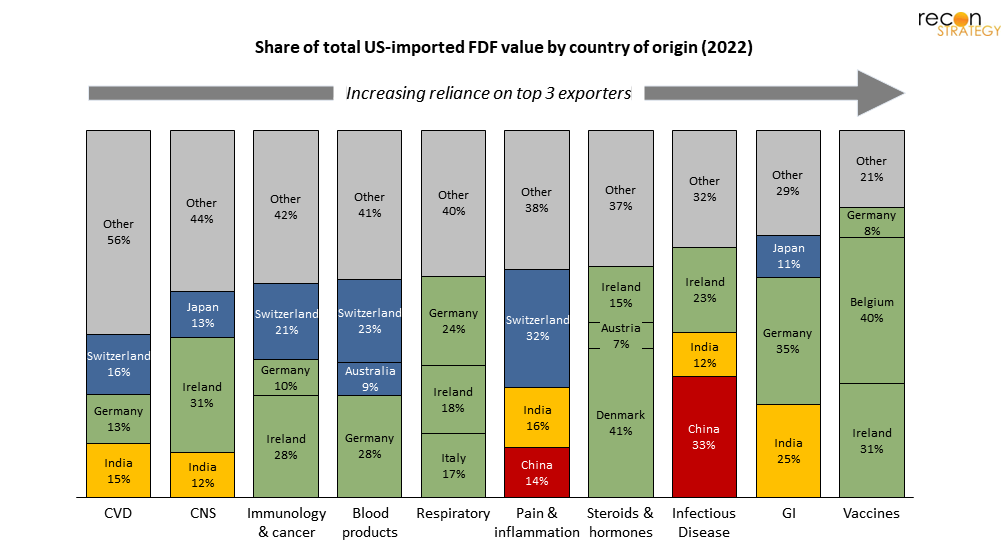
Figure 9. For most TAs, the top 3 exporters of FDF to the US represent 50-70% of total US import value
Finally, consider the GI-therapeutic class. These products are largely imported: the top 4 generic products (esomeprazole, mesalamine, pantoprazole, and omeprazole) all have their FDFs manufactured in India as well. In contrast to the cardiovascular market, GI is one of the least diversified and thus vulnerable therapeutic classes as measured by the share of US imports coming from its top 3 exporters (Germany, India, and Japan).
Looking across these three drug classes, (cancer/immunology, CVD and GI), a picture begins to emerge. While India and, to a lesser extent, China, are exporting a high number of CVD FDFs to the US—that isn’t necessarily where our supply chain is most concentrated/at-risk (GI), nor where the most attractive value-add opportunities lie (cancer/immunology).
If we seek to reshape the supply chain, private industry must consider the level of diversification. Certain steroids, hormones, and vaccines are largely supplied from a handful of EU countries and thus may be more “at-risk” than CVD or CNS drugs, which come from across the globe, including India, EU, and non-EU sources (in fact, the French government classifies many as critical and even subsidizes Sanofi for this reason, despite their high market share[22]).
Moreover, because the geographic distribution of the supply chain can change quickly, staying up to date is vital.
See below for an example; during recent launches of some high-value immunology products (for example, Keytruda and Opdivo) which have increased overall demand for antineoplastic products (generally, cancer-chemotherapies), India has rapidly won share and scaled the number of these drugs it exports to the US, now up to 7 times greater than in 2010. Relying on 10- or even 5-year-old data won’t cut it for an industry player looking to make informed decisions.
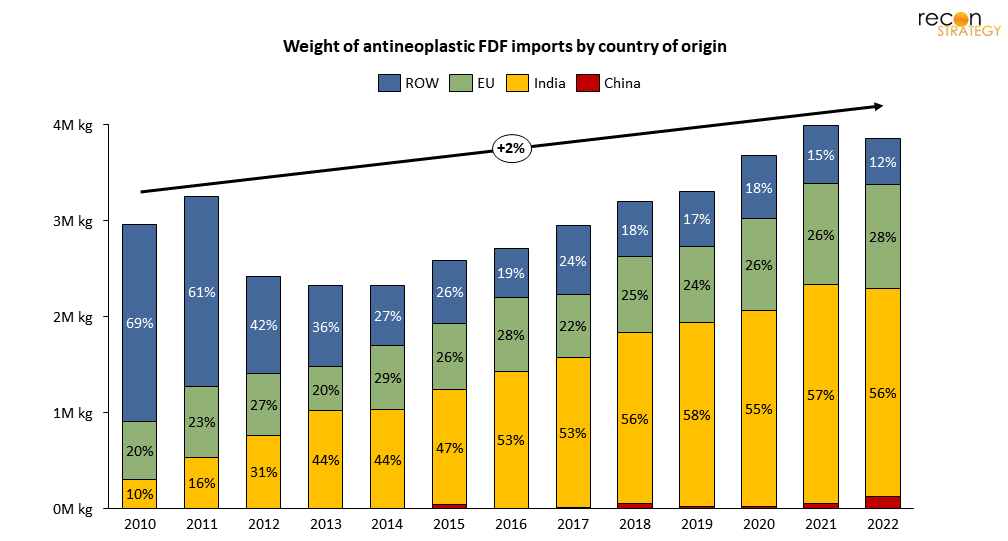
Figure 10. 56% of antineoplastic FDF import shipments into the US are now coming from India, up from 10% in 2010
While existing supply chain processes are sticky and switching costs are high, new capacity is up for grabs. As we’ve seen, new products can be high value (even if small volume) and highly skewed towards a particular country or product type. All of which raises the key question: What is more valuable: repatriation or future-proofing?
Repatriation or futureproofing?
Should the White House and, more impactfully, private industry focus on returning offshore jobs by changing supply chains to favor domestic production? Or, is the better play to “futureproof” against offshoring future blockbusters (or at least some preferable subset of innovative products)? It’s going to be very difficult to change course on existing supply chains, not only due to cost structure and raw-input sourcing/co-location, but also due to the switching costs that rerouting would entail. Offshore manufacturers already have experienced sites, human capital, established raw-material supply chains, electrical-grids, waste-treatment facilities, and logistical schedules.
It is important to note, though, that this is not always the case. Chemical drug processes tend to be more “transferrable” than biologics, which are often less tolerant to equipment or raw material input changes. On average, the requirements needed to shift manufacturing from an existing facility is today higher for biologics and complex molecules (e.g., oligos, RNAs, peptides) than it is for small-molecule chemical drugs, meaning a significant first-mover advantage.
Instead of trying to reroute the existing supply chain, it’s possible that US-based companies could collectively site a greater share of future product manufacturing in the US, with an emphasis on biologics, particularly newer modalities which are less “transferrable” across sites.
For example, J&J’s new CAR-T therapy site in New Jersey could give the US a sizable slice of the emerging CAR-T market. These drugs do not have the same degree of low-cost pressures as generics (which benefit India for some products), nor existing infrastructure (which keeps other products in China). It is a space US manufacturers could likely “defend,” not just today but in the years to come.
To focus on new complex modalities, more qualified human capital will be a prerequisite—and it looks like the US has some ground to make up here:
- The share of biological technicians in the US (for all industries) with a bachelor’s degree or higher has fallen from 50% in 2013 to 41% in 2019.[23]
- The number of biology and chemistry PhDs awarded annually (in pharmaceutical-manufacturing-relevant fields)[24] has grown only 0.4%/yr since 2010, less than the US STEM average of 2.9%, and less than China’s STEM average of 3.9%.
- Interestingly, the trend of biological technicians and scientists employed in the US pharmaceutical manufacturing industry has followed a divergent trajectory from the greater US market for these jobs. Despite the US employing ~24,000 more of these positions in 2020 than in 2012, the number employed in pharmaceutical manufacturing has decreased by ~4,000 (-3.6%/yr).
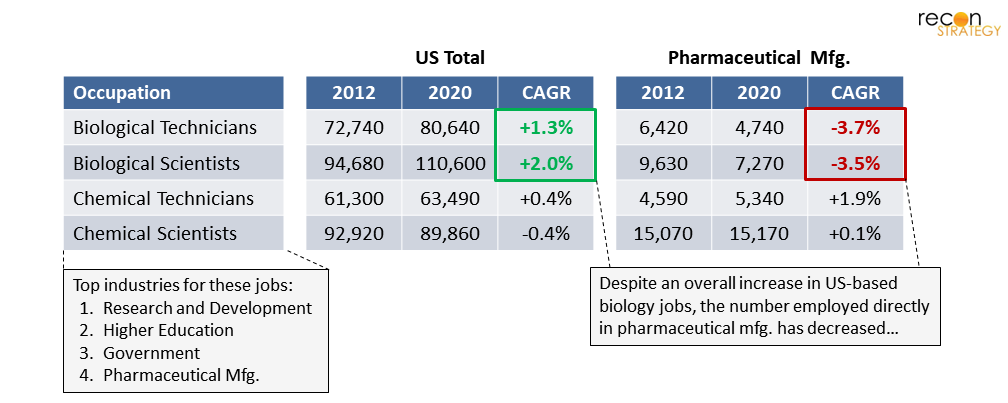
Figure 11. Employment of biological technicians and scientists in the US pharmaceutical manufacturing industry is falling significantly behind that of other industries competing for the same talent pool
Meanwhile, other industries employing biological technicians and scientists (research and development, higher education, and government) are, by implication, recruiting at disproportionately higher rates. For a future of US “futureproofing,” the pharmaceutical manufacturing industry will need to improve its recruiting yield in this area, which at the moment appears to be to the contrary of the labor market’s revealed preferences (be it a product of compensation, benefits, work content, job prestige, or otherwise—those entering the workforce appear to have found them less compelling for pharmaceutical manufacturing). In other words, there’s a need to create much stronger incentives for biological technicians and scientists to choose pharmaceutical manufacturing.
In contrast to biology and chemistry, non-life-sciences production jobs in the industry (e.g., machine operators, packaging) grew 1.8% per year, and sales and management jobs grew 5.6% per year—reflecting US-based companies selectively offshoring the production functions (as opposed to management).
So, given that US-based pharmaceutical manufacturing is recruiting fewer domestic biological technicians and scientists while increasingly relying on other countries for this work—a reality emerges: so long as other countries continue to produce more highly-qualified life-sciences talent per year, and that talent is incentivized to work in pharmaceutical manufacturing (or at least more so than in the US), there will continue to be an inherent, significant hurdle for the US to overcome domestic talent scarcity (and, accordingly, wage gap inflation).
We also expect a significant share of private industry investment to go towards improved drug-supply chain data and tracking (such as USP’s Medicine Supply Map)—you can’t effectively address a market if you can’t track or size it. Currently there’s a severe deficit of data on KSM and even APIs: 90% of API manufacturing for the top 30 generic drugs used in the US are unreported and largely unknown.[25] We might assume all are made in China and India (and may be correct on average), but this isn’t very conducive to informed, targeted change. See some examples below.
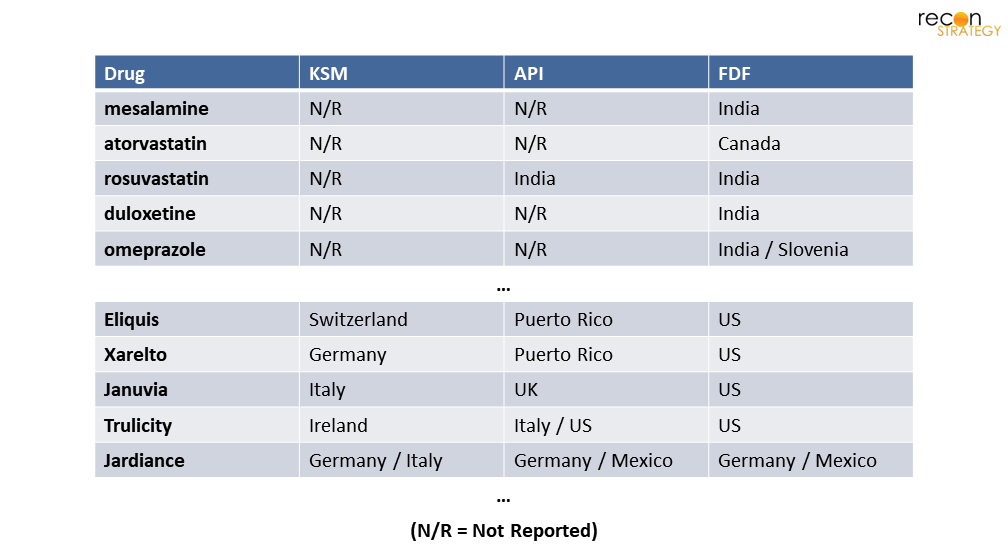
Figure 12. Sample of common generic and branded drugs and their countries of manufacture by supply chain stage
The truth is (and will remain for some time) that the US has become heavily reliant on imported medicines and has lost out on much of the key value-add opportunities along the way.
The largest pharmaceutical production occupation today in the US is at the very end of the value chain—packaging and filling, growing each year ~3 percentage points faster than all other production jobs. In contrast, countries like India, Ireland, and Switzerland have cemented themselves in the middle of the supply chain, importing APIs from China and India, exporting higher-value FDFs to the US market (for pack and ship) and bolstering their workforces in the process. For many products, this dynamic may be too entrenched to change without significant economic counterincentives (i.e., new and large import taxes). However, there will be a lot of new capacity at stake over the next decade, much of which in innovative modalities which the US has a real shot to win in. That is, if we can muster up a bit more capital than the White House initiative did.
Jacob Wiesenthal
Associate Consultant
Sarah J. Dolman
Partner
Download a PDF of this article here.
Appendix – Supply Chain Stages
Availability of systematically-collected data is largely limited to downstream supply chain stages.
Endnotes and Figure Notes
[1] The Guardian. “US secures world stock of key Covid-19 drug remdesivir”. Jun 2020.
[2] The White House. “FACT SHEET: The United States Announces New Investments and Resources to Advance President Biden’s National Biotechnology and Biomanufacturing Initiative”. Sep 2022.
[3] The remaining 155,000 pharmaceutical jobs include both sales and management functions as well as “ancillary” roles that support the production process but are not necessarily unique to pharmaceutical manufacturing (e.g., building maintenance, customer service, IT). BLS Occupational Employment and Wage Statistics 2021. NAICS 5-digit code 32541 is used to define pharmaceutical manufacturing industry, and OCC 2-digit codes 51, 17, and 19 are used to define physical production, engineering, and life science roles, respectively.
[4] TEConomy/BIO. The U.S. Bioscience Industry: Fostering Innovation and Driving America’s Economy Forward. 2022.
[5] In 2021, the national average annual salary for OCC code 51-9060 “Inspectors, Testers, Sorters, Samplers, and Weighers” was $44,810. The same OCC code had an average annual salary of $51,760 in the Pharmaceutical Manufacturing industry (NAICS 3254). BLS Occupational Employment and Wage Statistics 2021.
[6] The 7% growth in total manufacturing demand reflects all CDER-scope novel drugs, generics, and biosimilars reported as being in clinical trials, in pre-registration, approved for NME or BLA, or commercially launched in the US as of each year. This excludes preclinical drugs and certain stem cell therapies, vaccines, imaging agents, and companion diagnostics. Year of clinical trial start/approval is derived from the Pharmaprojects Trends Repository and has a typical margin of error of +/-12 months or less. Sources: Citeline Pharmaprojects. BLS QCEW 2010 – 2022, NAICS Code 32541.
[7] Examples include novel modalities (e.g., cell and gene therapies, antibody-drug conjugates) as well as complex platforms (e.g., continuous-processing, automation).
[8] BLS Occupational Employment and Wage Statistics 2021. NAICS 5-digit code 32541 is used to define pharmaceutical manufacturing industry.
[9], [14] The White House. “100-Day Reviews under Executive Order 14017”. June 2021.
[10] 19 of the top 21 critical antibiotics consumed in the US are dependent on foreign sources at some step in their manufacturing. Stephen W. Schondelmeyer statement before the US Senate. “Strategic Assessment of the Resilience of the U.S. Drug Supply with Lessons from the Pandemic & Recommendations for Moving Beyond”. May 2021.
[11] USP’s Medicine Supply Map is primarily used as an “early-warning system for possible drug shortages,” which draws from more than 40 datasets covering 22,000 global manufacturing locations.
[12] For example, products made via complex technologies such as continuous, automated, or electrochemical processes; alternatively, molecules that require complex handling, such as high-potency products.
[13] For example, nearly all solvents are volatile and must be shipped in sealed containers, oftentimes with secondary containers. Chemicals that contain highly reactive structural elements (e.g., azides, nitrosos) require additional precautions, limits on shipment wright, low-temperature controls, and detailed documentation and training for transporters
[15] Endpoints News. “ARCH-backed Resilience nabs its latest financing round, putting together a massive $625M Series D”. Jun 2022.
[16] United States Bureau of Industry and Security. “Commerce Implements New Export Controls on Advanced Computing and Semiconductor Manufacturing Items to the People’s Republic of China (PRC)”. October 2022.
[17] One of the forces driving J&J and Legend to open their New Jersey manufacturing site is the global shortage of lentiviral vectors, which are key in producing the newly approved CAR-T therapy Carvykti. By building out capacity in the US, J&J and Legend hope to avoid vulnerabilities in the global supply chain and have a dependable, domestic source of production during a key ramp-up period in Carvykti sales. Also, Lilly’s $2.1B investment in two new manufacturing sites in Indiana follow another $1B for an injectables factory in North Carolina earlier in the year.
[18] Recent examples include Forge Biologics’ $300M, 138k sq. ft. investment in gene therapy capacity, Thermo Fisher’s $180M, 290k sq. ft. facility in Plainville, MA, Vibalogics’ $150M, 110k sq. ft. facility in Boston, MA, and over 12 others in the US totaling $1.9B+ in the last 3 years.
[19] In Canada and Europe, however, the selling price is higher for generics and thus the margin differential is less apparent than in the US.
[20] This figure also includes some strictly “metabolic” drugs, which are inseparable from CVD drugs in the US import data.
[21], [25] Stephen W. Schondelmeyer statement before the US Senate. “Strategic Assessment of the Resilience of the U.S. Drug Supply with Lessons from the Pandemic & Recommendations for Moving Beyond”. May 2021.
[22] The LFB Group is a public French company that manufactures plasma-derived medicinal products.
[23] BLS Employment Projections, Employment by Occupation and Educational Attainment. 2013 – 2019.
[24] National Science Foundation, Survey of Earned Doctorates. 2022. Biology and chemistry PhDs per year as referenced above exclude certain fields of study listed under the NSF’s “biology” or “chemistry” categories but unrelated to pharmaceutical manufacturing, such as anatomy, botany, ecology, zoology, and polymer chemistry.
Figure 1. US Pharmaceutical Consumption Expenditures are derived from National Income and Product Accounts (NIPAs) within the consumption category “pharmaceutical and other medical products.” Value of US-imported APIs + FDFs are derived from US international trade data at the 10-digit Harmonized Tariff Schedule (HTS) level for commodity categories “organic chemicals” and “pharmaceutical products” and end-use category “pharmaceutical preparations” (for APIs). Assumes ~2.3x multiple of consumer value to producer value as estimated by NIPA. Sources: BEA Historical PCE Bridge; USA Trade Online; Recon analysis.
Figures 2, 6. Includes all CDER-scope novel drugs, generics, and biosimilars reported as being in clinical trials, in pre-registration, approved, or commercially launched by country as of each year. Excludes preclinical drugs and certain stem cell therapies, vaccines, imaging agents, and companion diagnostics. Year of clinical trial start/approval is derived from the Pharmaprojects Trends Repository and has a typical margin of error of +/-12 months or less. Global pharmaceutical employment interpolated from 2007 – 2012 and 2017 estimates from WifOR. Sources: Citeline Pharmaprojects. WifOR Research Report: The Global Economic Impact of the Pharmaceutical Industry 2015, 2020. BLS Quarterly Census of Employment and Wages 2010 – 2022 NAICS Code 32541; Recon analysis.
Figure 7. Values reflect share of manufacturing facilities, which may differ from each country’s share of manufacturing volume. Determined for all FDA-regulated drugs. Source: The White House: Building Resilient Supply Chains, Revitalizing American Manufacturing, and Fostering Broad-based Growth. June 2021.
Figures 8, 9. Therapeutic areas are designated by Recon based on 10-digit HTS commodity code descriptions. Because both immunology and cancer-related FDFs share some HTS codes, they cannot be separated in the US trade data and are thus combined here into a single TA import line. Sources: USA Trade Online; Recon analysis.
Figure 10. Antineoplastic FDFs are selected from HTS code “3004909115 Antineoplastic and Immunosuppressive Medicaments.” Sources: USA Trade Online; Recon analysis.
Figure 11. Pharmaceutical manufacturing industry defined as NAICS code 3254. Sources: BLS Occupational Employment and Wage Statistics; Recon analysis.
Figure 12. Source: Stephen W. Schondelmeyer Statement on “Strategic Assessment of the Resilience of the U.S. Drug Supply with Lessons from the Pandemic & Recommendations for Moving Beyond” at the US Senate Hearing on COVID-19 Part II: Evaluating the Medical Supply Chain and Pandemic Response Gaps.” May 2021.