
Download a PDF of this paper here. A comprehensive slide-deck (including a breakdown by therapeutic area) and a complete list of assets deals are also available; click [datapack] to access.
Earlier this year, we published a whitepaper on preclinical licensing deals that showed most deals publicize very different “biobucks” compared to what is collected. It struck a nerve, generating a lively conversation amongst drug-hunters, BD&L teams and investors. We started to wonder: are deal values any more rational for Phase 1 assets (which already have human safety data)? Below, we share a few insights culled from our analysis of asset deals announced between 2010 – 2015.
Phase 1 assets are a smaller share of deal volume.
Looking back at the deals tracked in Evaluate1 over the last 20 years, we see that Phase 1 (Ph1) assets are a smaller share (~12%) of deals than either preclinical or Phase 2 assets in every year (Figure 1). Unsurprisingly, licensors’ press-releases continued to state “biobucks” based on the total potential value of these deals, not the upfront amount or risk-adjusted (for either timeline and PTRS) value.
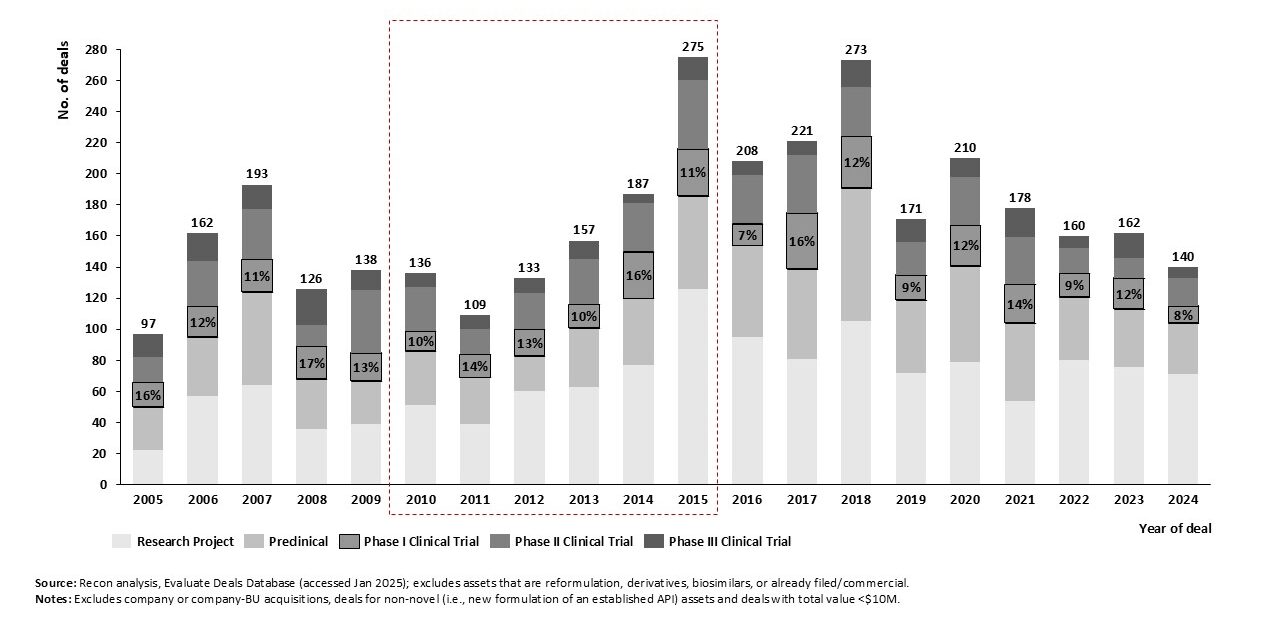
Figure 1: Number of deals for novel development assets between 2005 – 2024.1
Fewer Bets Overall, But More Interest Outside Oncology and Rare.
The dataset lists 122 deal-announcements for Ph1 assets between 2010-2015 (again excluding deals valued <$10M or where neither party was US/EU-based). To be consistent with our prior approach, we excluded 11 deals that were for entire-pipelines or non-NMEs.2 After careful cross-reference to historic press releases, company reports, presentations and websites, we determined that another 38 listings were inaccurate (duplicative, not a true acquisition, or misassigned as Ph1).3,4 This left us with 73 assets, (including 3 assets in Ph1/2 studies5) worth up to ~$22.1B in potential payments (per Figure 2).6 The total value here is just ~42% of what was earmarked for preclinical assets (~$53B).7
However, dealmakers offered substantially more for these assets, both overall ($304M vs. $231M) and upfront ($26M vs. $22M) compared to preclinical. Notably, while oncology continues to dominate deals by volume (24, 33%) and value ($9.4B, or 41%), a significantly larger proportion of total value is also promised for both CNS ($3.2B, or 14%) and inflammation ($3.6B, or 16%), compared to preclinical deals (CNS and inflammation captured <6% and <8% of all preclinical biobucks, respectively).
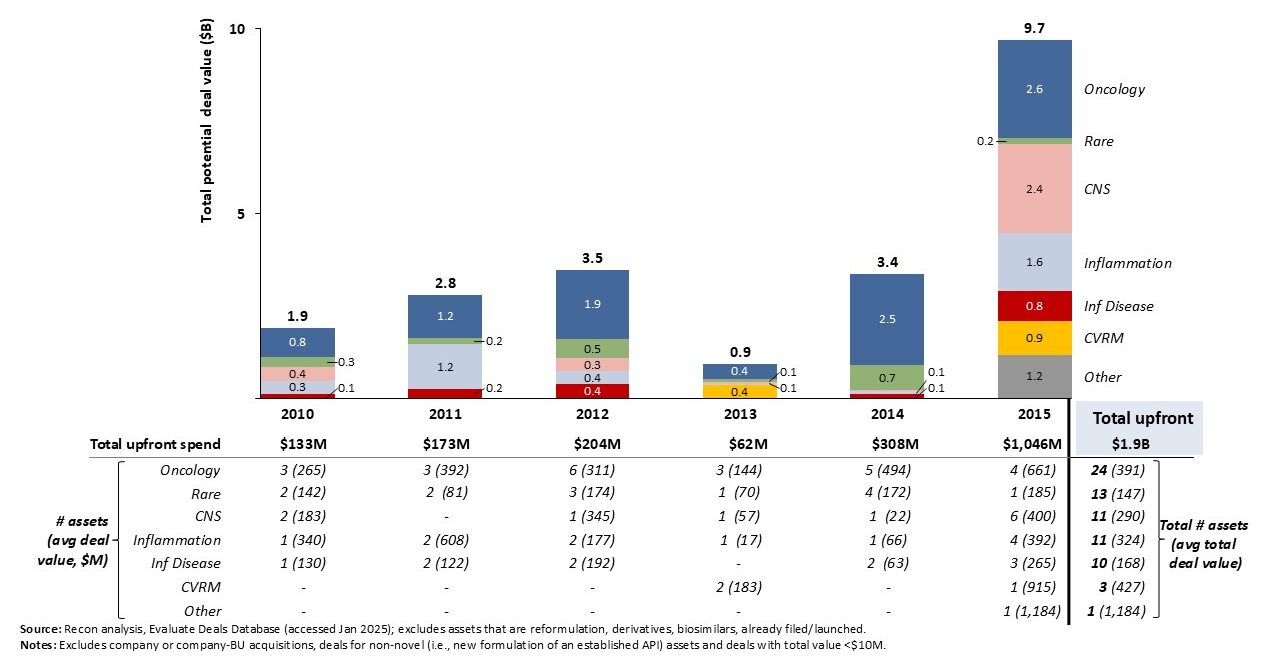
Figure 2:Total potential-revenue from deals for novel Phase 1 (Ph1) asset deals from 2010 – 2015.1,6
Similar-size and shape bets, despite being IND-approved.
However, if you were hoping Ph1 deals might offer more consistency in deal terms, think again. These deals show equally wide variability (in both upfront and total payment) as preclinical (Figure 3). That said Oncology does seem to win the most high-value terms – particularly for overall potential value. This stands in contrast to preclinical deals, where no TA seemed more likely to win exceptional terms.
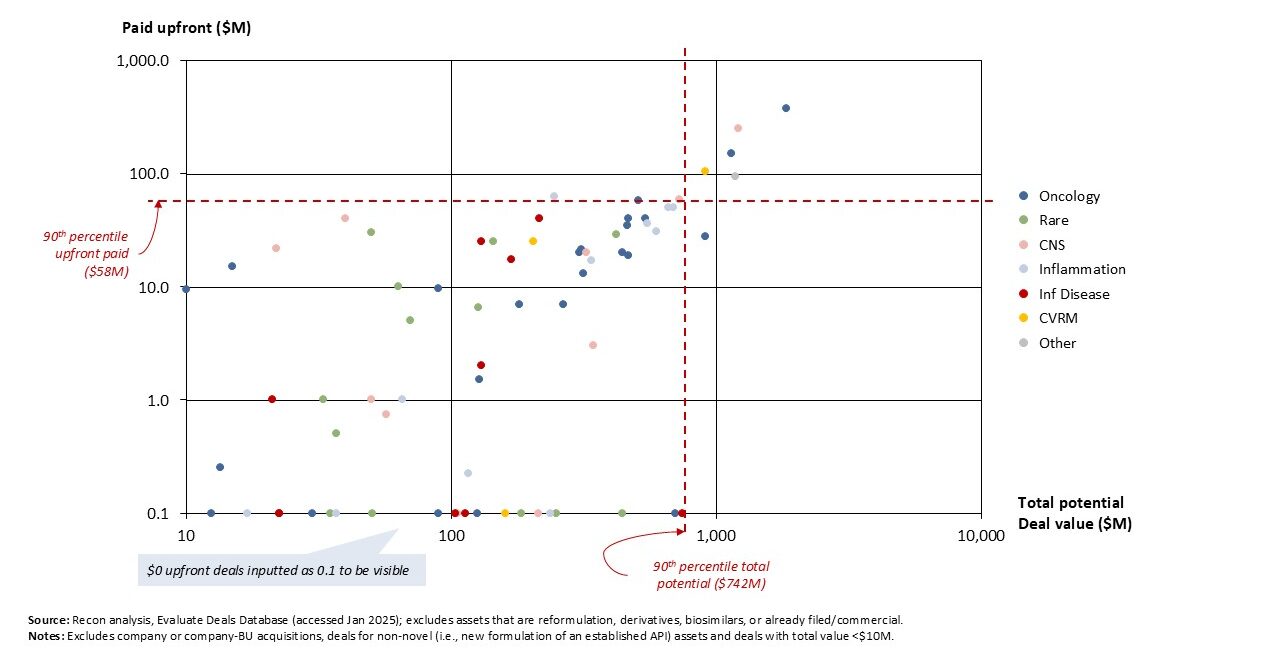
Figure 3: Upfront and total potential payments for novel Ph1 asset deals from 2010 – 2015.1,6
Competitive Pressure Appears Less Important on Development Speed.
As before, we used the presence of other assets with the same biologic target (or MOA), and the stage of those programs, to characterize each assets’ competitive landscape. The pattern of competitive intensity influencing development speed, seen in preclinical, does not hold now. Licensed Ph1 assets advanced rapidly, whether the competition was substantially ahead (Figure 4A, 4B) or essentially neck-in-neck (Figure 4C, 4D).8 Even when there is no defined competition (Figure 4E), most assets entered Ph2 studies within 2 years. Although development speed does not seem dependent on competition, a ceiling effect (for novel or lightly validated targets) may still be in play.
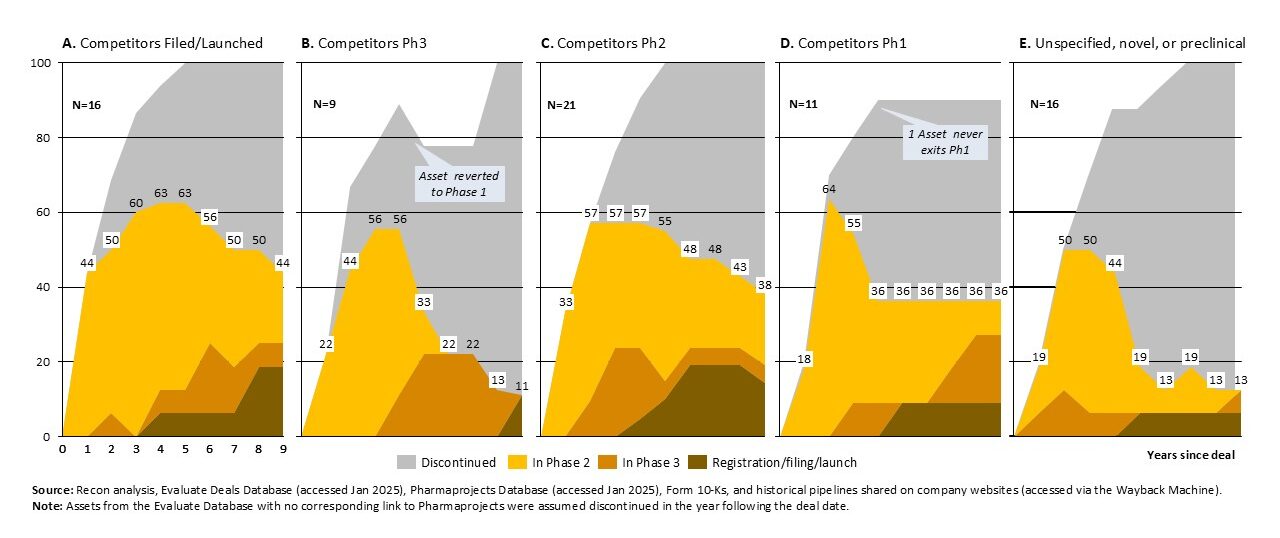
Figure 4: Progression through development stages, for novel Ph1 assets subject to deals between 2010 – 2015.8
Big Upfronts and Competitive Maturity Don’t Always Predict Success.
In preclinical deals, larger upfronts were typically tied to assets where competitors were ahead, most often in late-stage (Ph3+) development. However, as can be seen in Figure 5, that pattern doesn’t hold for Ph1. Competitive maturity doesn’t seem to matter much either: many assets that reached filing+ were just 1-stage behind competitors. Swapping upfronts for total potential deal value (Figure 6) doesn’t clarify much. Many of the assets that successfully launched were lower overall value (e.g., Ervebo, Soronho, Kymriah); there’s little correlation between stated biobucks and success.9
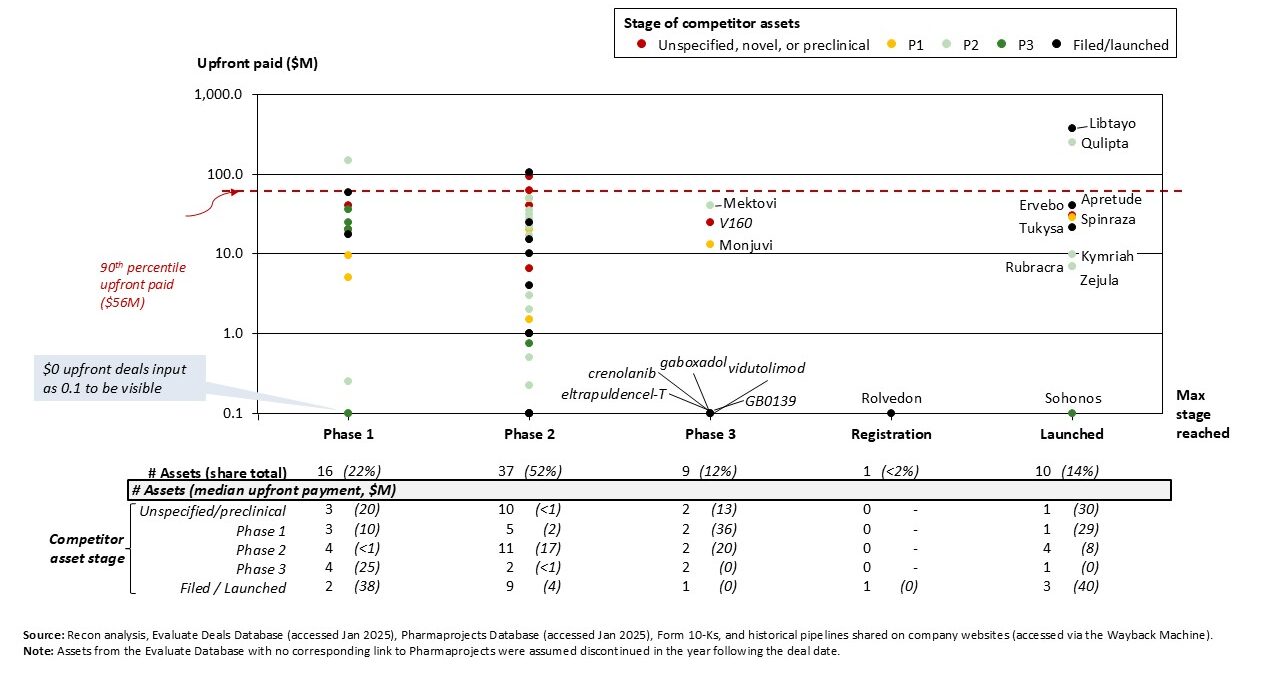
Figure 5: Upfront payments for novel Ph1 assets vs. latest-development stage reached, for deals from 2010 – 2015.1,6
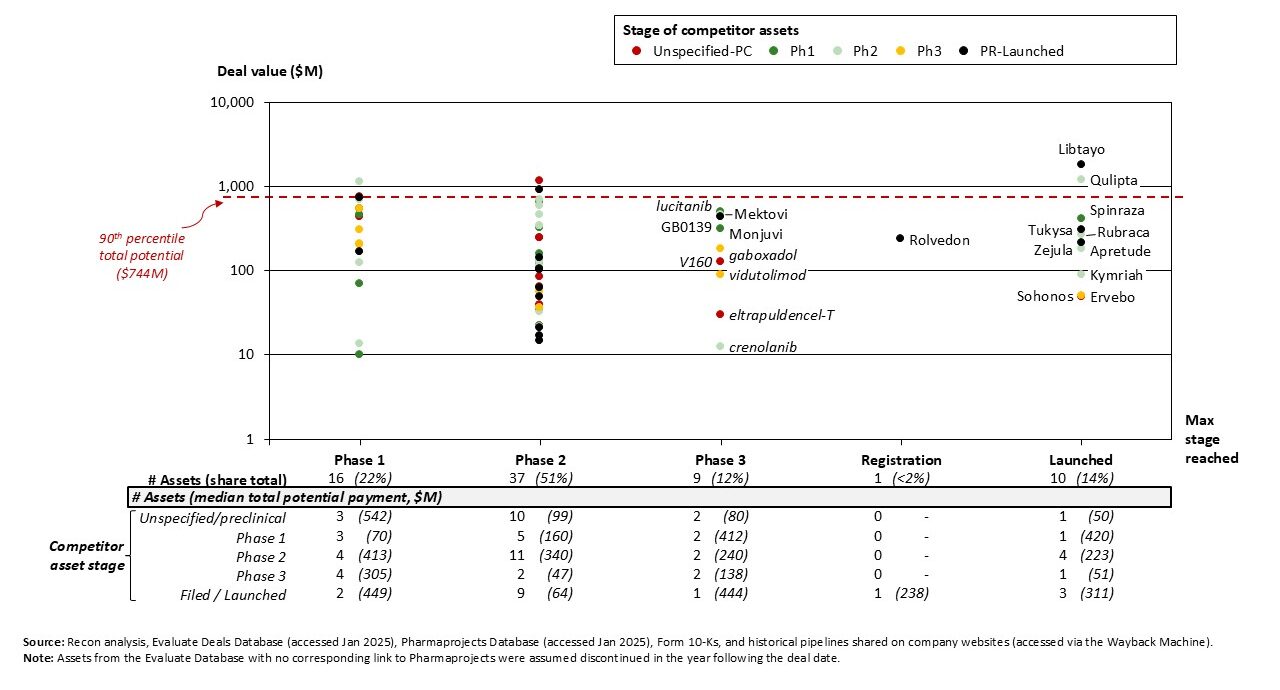
Figure 6: Total potential payments for novel Ph1 assets vs. latest-development stage reached, for deals from 2010 – 2015.1,6
A Handful of Winners Drive Most of the Realized Value for Ph1 Assets.
That said, a much higher share (~2.5x greater) of these assets are making it across the finish line: 11 assets reach registration or launch (15% overall) within the period (9-years). Our model9 also suggests licensors collected much more of the announced value, for a total of ~$6.9B across all deals, or 32%. When we break it down by leading TAs and competitive intensity, it becomes clear that a handful of successes (Liptayo, Qulipta and Spinraza) drive most of the value (Figure 7) gained. Without these successes, the revenue captured (by licensors) vs. promised would be far less.
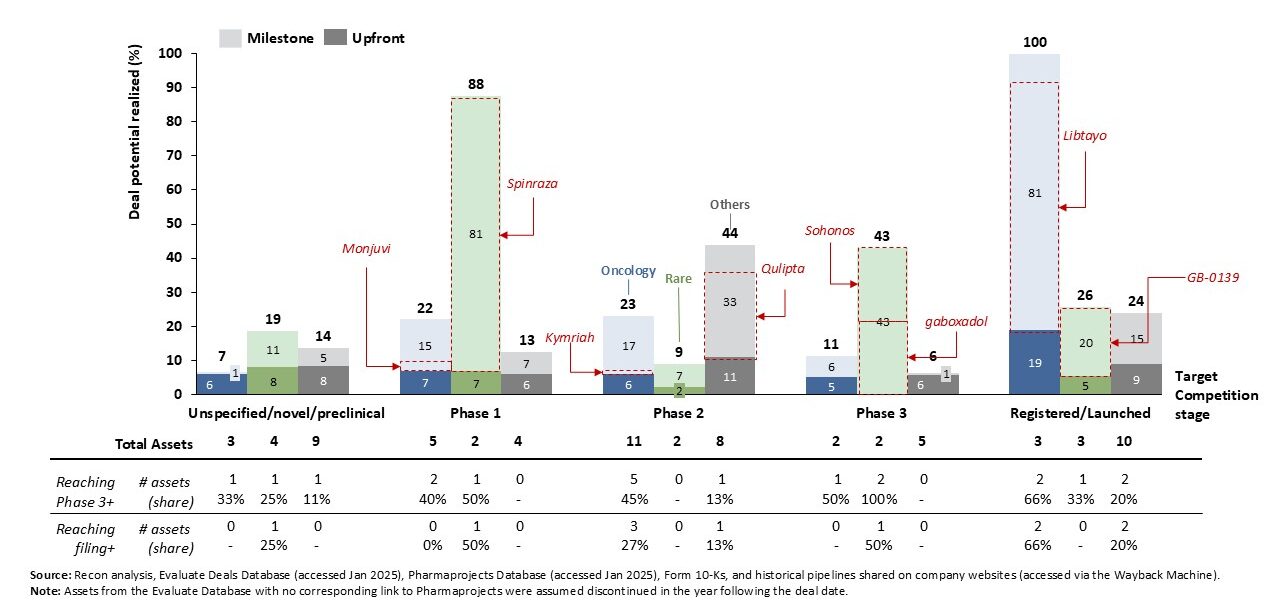
Figure 7: Estimated share of deal potential realized (9 years after deal) by licensors for novel Ph1 asset from 2010 – 2015.6,8,9
Conclusion
With human safety data in hand, Ph1 asset deals garner more than preclinical: buyers typically pay ~20% more upfront and ~30% more overall. Still, because most programs stall before Phase 3, much of the headline biobucks is unlikely to materialize. Certainly, these assets are a better bet than preclinical, but sellers would be wise to remember that milestone payments require program success, which is far from guaranteed.
Notes & references
[1] Sources: (a) Evaluate Deals Database. Accessed Jan 2025. Available at: evaluate.com. (b) Pharmaprojects Drug Database. Accessed July 2025. Available at citeline.com.
[2] Excludes assets that are reformulation, derivatives or biosimilars have commercial products and products that were already filed/launched and deals with total value <$10M.
[3] We found 9 whole-pipeline/BU deal listings, as well as 2 for new formations or combinations of established products.
[4] 15 deal records were duplicates and 1 record was actually a fundraising announcement (with no indication of rights to future development or sales). 7 assets were actually in preclinical or discovery-stage, while another 15 assets were in Ph2+ or later stage development.
[5] Pharmaprojects typically lists assets in Ph1/2 studies as being in Phase 2. We elected to include these two assets with other Ph1 assets since human safety data is at a similar stage.
[6] Payment values reported by Evaluate taken as-is, unless the deal covered multiple assets, with the most advanced stage being Ph1. In this case, 90% of total deal value was assigned to the Ph1 asset(s), as preclinical and earlier stage programs are higher-risk and generally considered lower-value. If the deal included >1 Ph1 asset, each was considered equally valuable. I.e., If a $100M deal covered one Ph1 and three preclinical assets, then $90M was attributed to the Ph1 asset ($100M x 90%); if the same deal included two Ph1 assets with three preclinical, then $45M was attributed to each Ph1 asset ($100M x 90% x (1/2)).
[7] Buhay, N., Dolman, S.J. Preclinical Licensing Deals Realized Value., Recon Strategy, 2025. https://reconstrategy.com/2025/04/preclinical-licensing-deals-realized-value/
[8] Asset progression determined based on our analysis of across: (a) Citeline’s Pharmaprojects Database. (b) publicly available company 10-Ks, (c) historical pipelines shared on company websites (accessed via the Wayback Machine; available from https://web.archive.org/). Note: Assets from the Evaluate Database with no corresponding link to Pharmaprojects were assumed discontinued in the year following the deal date.
[9] We leveraged historical industry data from BiotechGate (Venture Evaluation Report, 2020, which covers >7,500 biotech deals) to model the expected value of milestone payments tied to progressing to the next development stage. We estimated the implicit value of each stage-transition to be equivalent to the proportional difference of average deal-vale by clinical stage (i.e., average deal-values of $146M for Ph2 vs. $115M for Ph3 suggests that a Ph2→Ph3 transition is worth ~20% of all milestone payments).
[datapack]
Please fill out the form below to download a slide-deck of the data in our analysis, including break-down by individual TAs. For the full list of asset-level deals, please email sarah@reconstrategy.com to register your interest. We’ll follow up with next steps.