
Download a PDF of this paper here.
M&A deals in biopharma often capture headlines for their large valuations, yet these figures rarely reflect the true financial return realized over time, as most fail during development. Typical deal-structures involve a modest upfront payment with more significant sums tied to development milestones – which allows buyers to preferentially invest in assets they view with greater odds of success. Do buyers accurately assess development programs, and do upfront payments match the potential for success of assets in these transactions? Or do sellers collect more than their assets are ultimately worth? Below, we share a few insights culled from our analysis of asset deals announced between 2010-2015.
Despite their limited data, assets at the preclinical stage represent a substantial share of all deals made in biopharma.
In the last 20-years, ~26% of all assets licensed for more than $10M by US or EU-based biopharma were in the preclinical stage (Figure 1).1 Although press releases focus on whole deal value, usually the bulk of that value is realized only if milestones are met. We decided to look at 6 of these annual deal cohorts that could be fully evaluated over a sufficient period – for upfront share, clinical progression and potential realized.
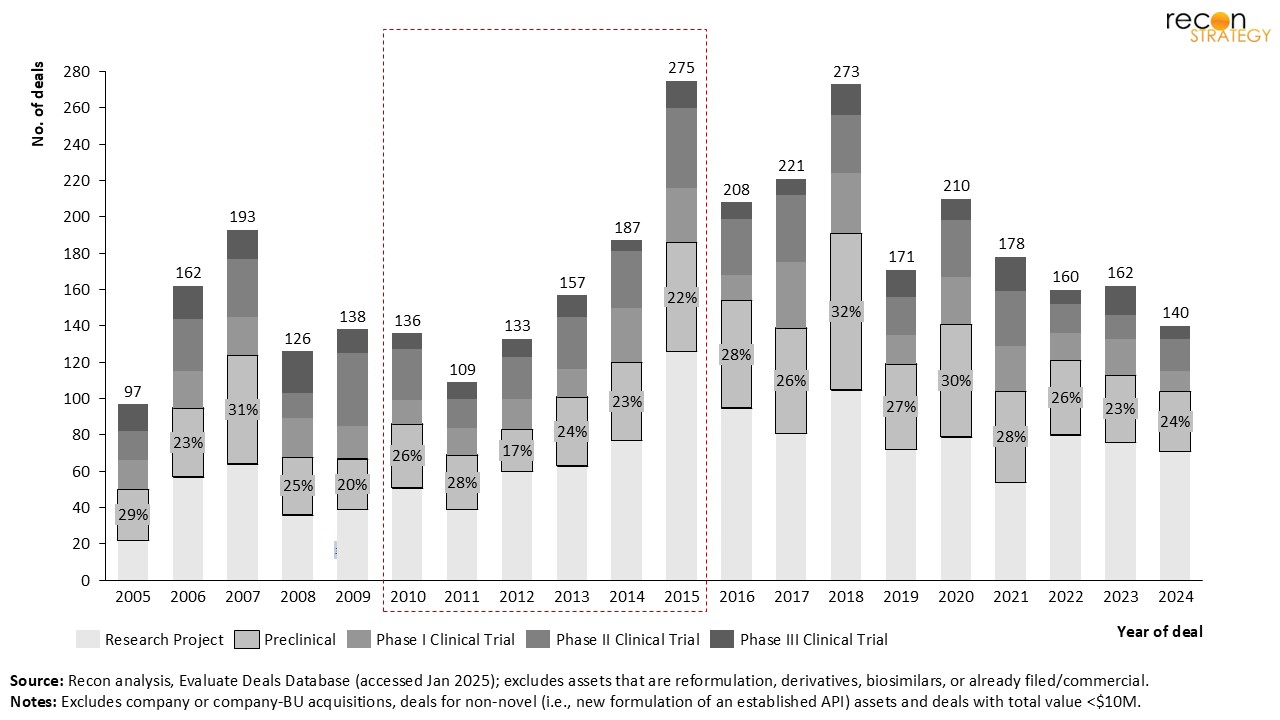
Figure 1: Number of deals for novel development assets between 2005 – 2024.1
Every year, over $5B in capital is promised for high-risk preclinical assets; far less is transferred immediately.
Our analysis of licensing deals for 229 preclinical assets signed between 2010 and 2015 shows that each year over $5B was promised in potential future payments for licensed assets, maxing out at nearly $20B in 2015 (Figure 2). During this period assets for oncology heavily dominate deal volume (109, or 48% of all assets) and value ($25B, or 48%). While only ~5% of the total potential value is typically paid upfront, in aggregate these payments are substantial – ranging from a low of $140M in 2013 to a high mark of nearly $1B in 2015.
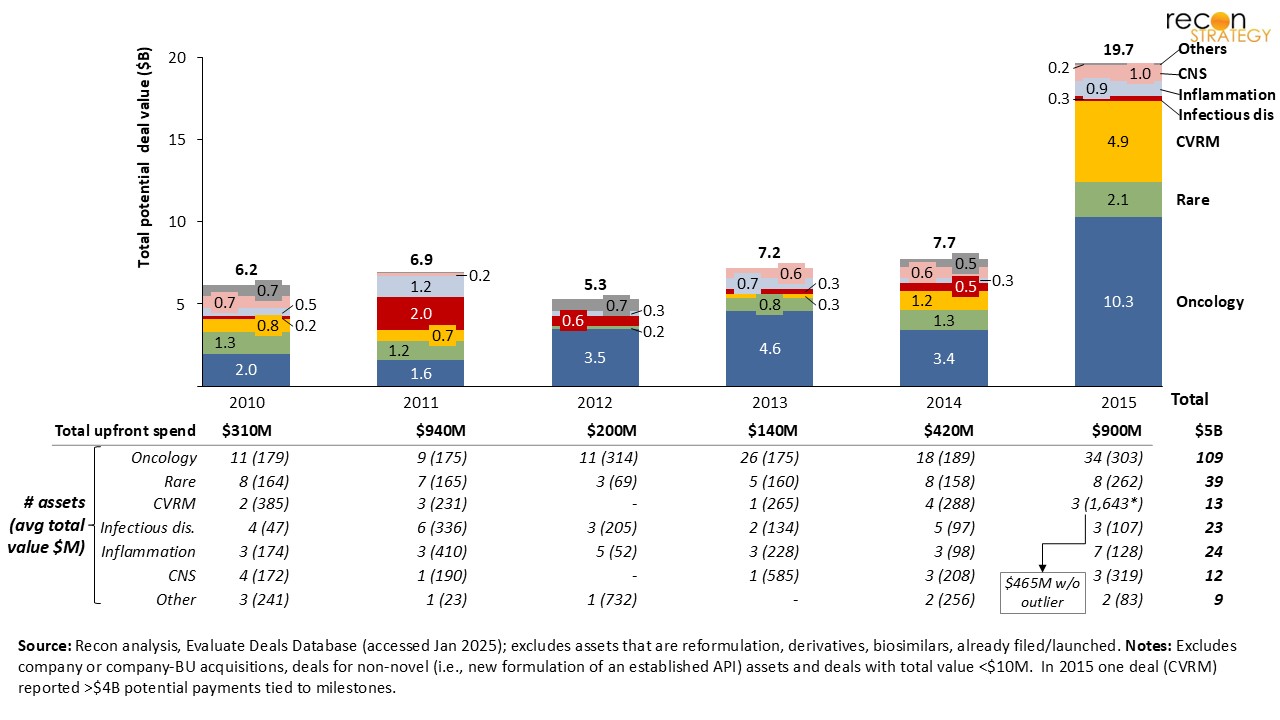 Figure 2: Total potential-revenue from deals for novel preclinical asset deals from 2010 – 2015.2
Deal structures vary widely, with little consistency between what might eventually be paid and what is transferred upfront.
There is a wide range of upfront and potential total payment, without any clear correlation (Figure 3 – note axes are logarithmic). Deals above the 90th percentile (in either upfront or total potential payment) occur for all TAs. While oncology and rare disease seem to dominate these extremes, these are the most common TAs seen amongst deals. Taken together, this suggests that deal size is shaped by other factors —things like target biology, platform novelty, or buyer strategic fit likely play a bigger role.
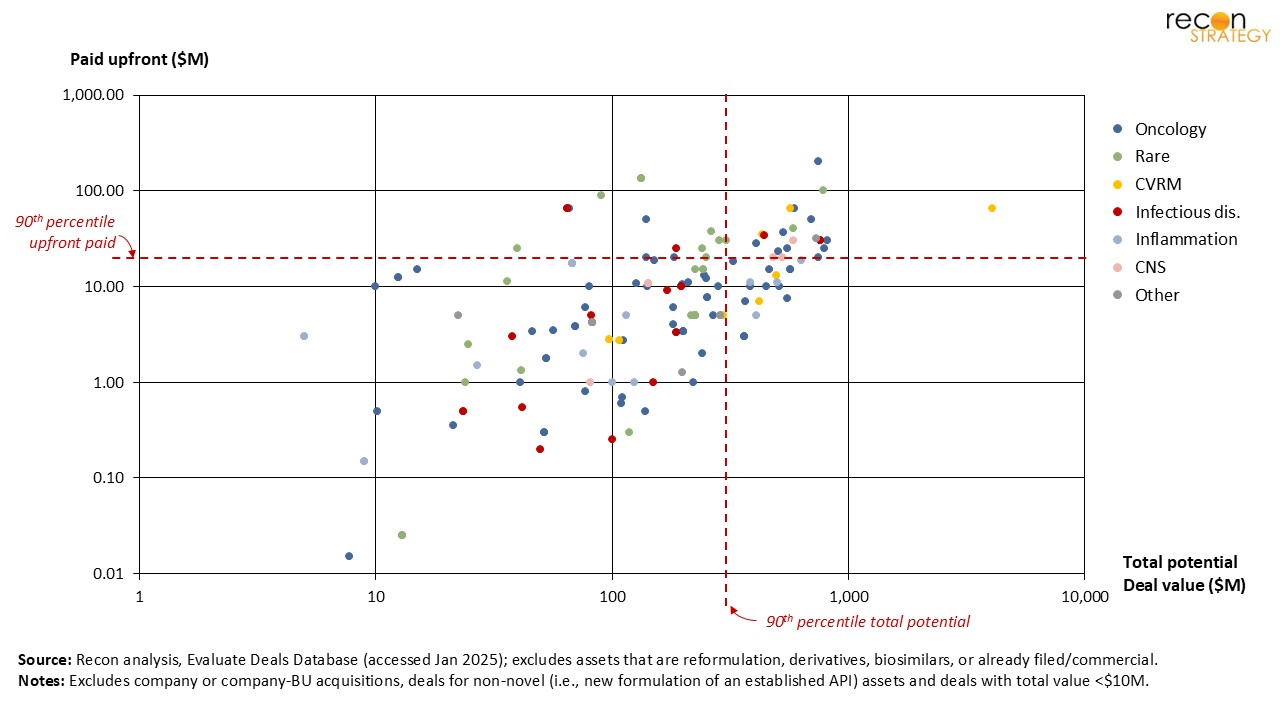 Figure 3: Upfront and total potential payments for novel preclinical asset deals from 2010 – 2015.3
Developers progress assets rapidly when the target has clinical-stage competition.
As shown in Figure 4, assets without a specified target (Column D), rarely progress into the clinic; which suggests these programs have low priority or weak preclinical data. In contrast, when competitors’ assets are late stage (Ph3+, Column A), and presumably the target biology well-validated, entry to the clinic is rapid. While slower, movement into clinical development still occurs at a reasonable pace when competitors are in Phase 1/2 (Column B) or even preclinical (Column C), though overall progression and survival rates diminish as competitor maturity declines. In short, target competition appears to be a strong signal of strategic urgency. When others are further ahead, sponsors seem more willing to act fast, possibly to avoid being left behind—or to be first with a differentiated angle in the same space.
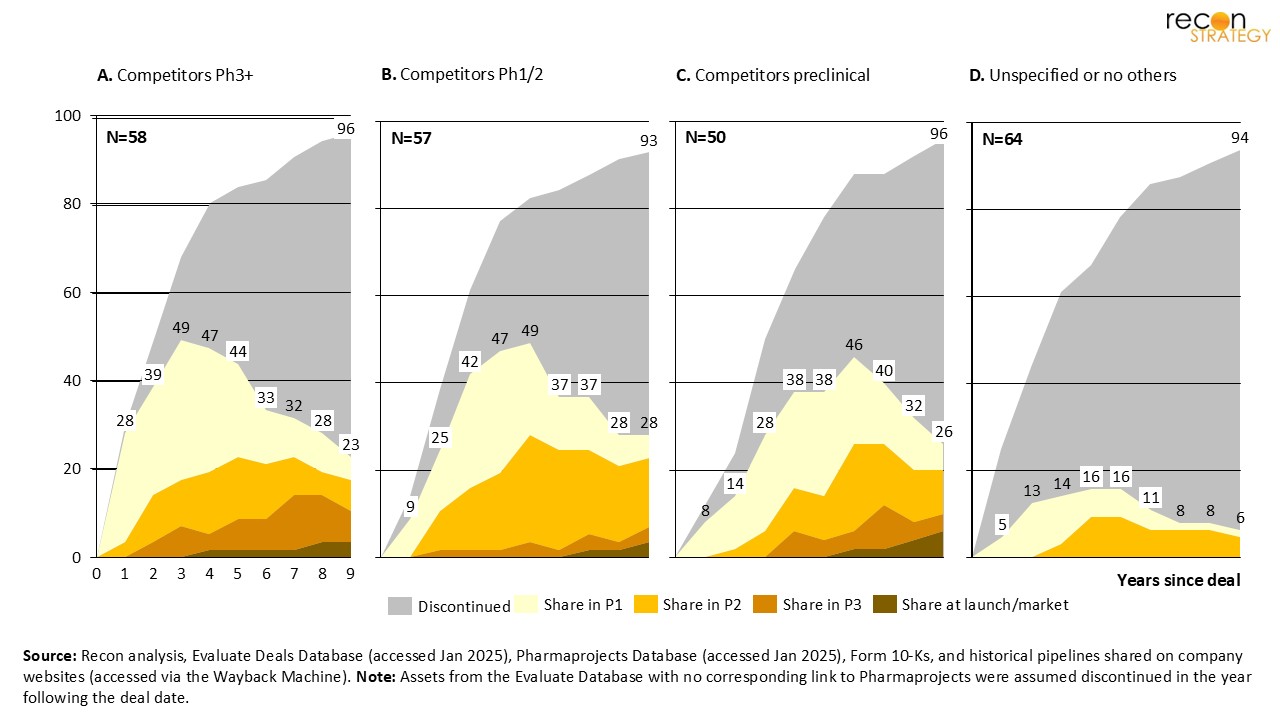 Figure 4: Progression through development stages, for novel preclinical assets subject to deals between 2010 – 2015.4
Upfront payments typically reflect competitive context.
A target’s competitive maturity (and presumably, clinical validation of the target by other assets) appears to have more impact on upfront payments than overall promised revenue, or how far the asset progresses (Figure 5). With the exception of assets that never progress beyond preclinical, upfront payments are consistently higher when competitor assets are already in Ph3+ (green dots). In contrast, programs that lack competitors (red dots) tend to command far lower initial investment. Interestingly, some of the highest upfronts went to assets that never reached the clinic ($133M for RTA 404, $90M for FVII-GEX, both in rare disease) or stalled at FIH ($200M for ADU-S100, $65M for pinometostat, both in oncology) while several lower-upfront deals ultimately made it to launch ($3.8M each for Jemperli and Copiktra, both oncology). In short: high upfronts track with competitive pressure—not with future performance.
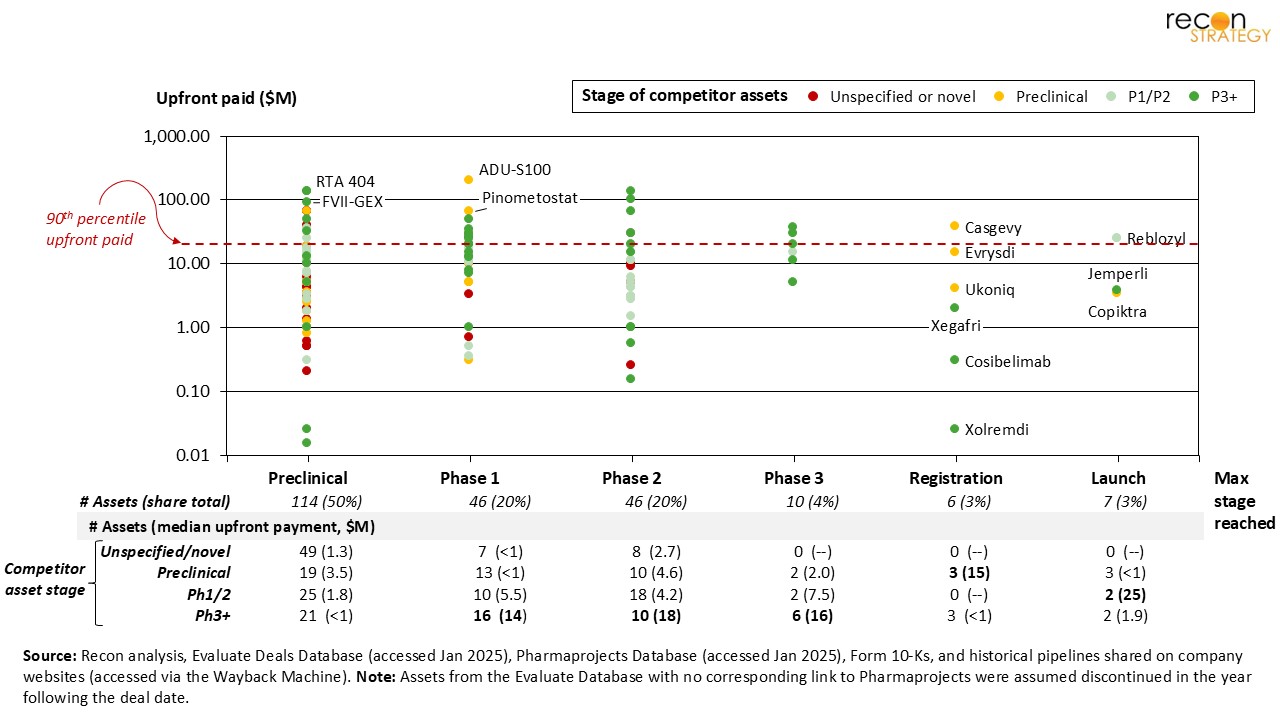 Figure 5: Upfront payments for novel preclinical assets vs. latest-development stage reached, for deals from 2010 – 2015.3,4
Most preclinical deals deliver only a fraction of promised revenue.
Finally, our analysis suggests that preclinical asset licensors typically realize only a small portion of the total deal value (estimated based on progression reported5) — often less than 20% — even nine years post-deal. In particular, deals where the target was unspecified or novel delivered just 5–7% of their total potential. In contrast, deals for assets tied to targets with Ph3+ competition, particularly in oncology or rare disease, captured much more, on average 24-39% of the total potential. Unsurprisingly, these results were tied to higher rates of reaching late-development (Ph3 or beyond).
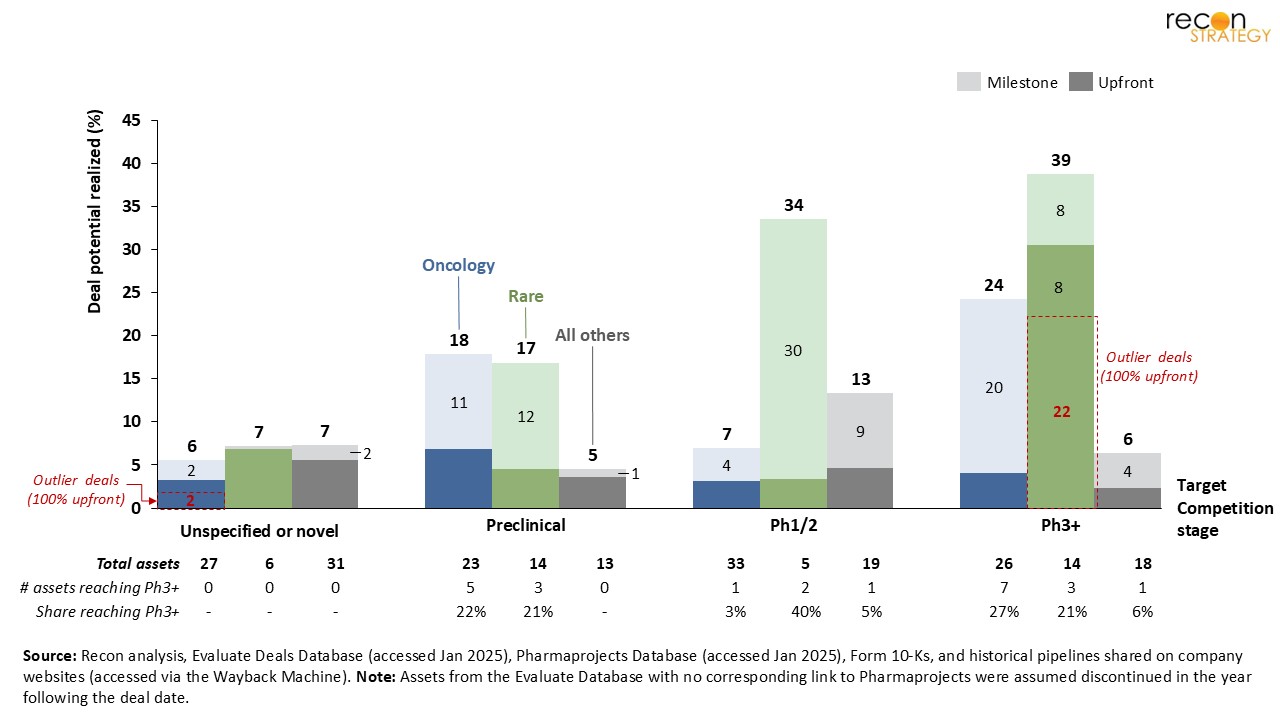 Figure 6: Estimated share of deal potential realized (9 years after deal) by licensors for novel preclinical asset from 2010 – 2015.3,4,5
Conclusion
While upfront payments are small relative to total deal value, they still represent significant capital—and are often misaligned with downstream performance. Buyers appear to acknowledge biological risk in structuring upfronts, but continue to pursue large volumes of high-risk preclinical assets, especially in oncology. Competitive landscape (presence and clinical stage) of target emerges as the most reliable signal of value, predicting both clinical progression and milestone realization. For deal- makers, this suggests a sharper focus on biological rationale could improve return on investment. For sellers, strong validation data may not only improve terms but also the likelihood that milestones—and full deal value—are ultimately achieved.
Notes & references
[1] Excludes assets acquired as part of deals for whole-company or entire businessunits. Source: Citeline, Evaluate Deals Database. Accessed January 2025. Available from: https://pharmaintelligence.informa.com/products-and-services/data-and-analysis/evaluate.
[2] Excludes (1) assets that are reformulation, derivatives or biosimilars have commercial products and products that were already filed/launched, (2) whole company or business unit acquisitions, (3) deals for non-novel products (i.e., new combinations of established APIs) and (4) deals with total value <$10M.
[3] Same exclusions as above; payment values as reported by Citeline (source details above).
[4] Same exclusions as above; asset progression determined based on our analysis of multiple sources: (a) Citeline, Pharmaprojects Database. Accessed January 2025. Available from https://www.citeline.com/en/products-services/clinical/pharmaprojects, (b) publicly available company 10-Ks, (c) historical pipelines shared on company websites (accessed via the Wayback Machine; available from https://web.archive.org/). Note: Assets from the Evaluate Database with no corresponding link to Pharmaprojects were assumed discontinued in the year following the deal date.
[5] We leveraged historical industry data from BiotechGate (Venture Evaluation Report, 2020, which covers >7,500 biotech deals) to model the expected value of milestone payments tied to progressing to the next development stage. We estimated the implicit value of each stage-transition to be equivalent to the proportional difference of average deal-vale by clinical stage (i.e., average deal-values of $146M for Ph2 vs. $115M for Ph3 suggests that a Ph2→Ph3 transition is worth ~20% of all milestone payments).