
Summary:
We conducted a comparative analysis of the referral networks of orthopedic surgeons in King County (the area around Seattle, WA) and Miami-Dade County.
Similarities
- Bigger systems are better at keeping referrals internal
- So, the level of fragmentation in the referral base is associated with the level of fragmentation in the specialty market structure
- Despite this, a consolidated referral base does not necessarily mean that systems are able to keep orthopedics referrals internal
Miami-Dade
- Independent physicians make a significant proportion of referrals (9.4%)
- So, independent surgeons receive a significant proportion of patient referrals (18%)
- And the orthopedics market structure is highly fragmented (HHI[1] of 1,049)
King
- Independent physicians do not make a significant proportion of referrals (1%)
- And there are no independent orthopedic surgeons receiving referrals
- Not surprisingly, the orthopedics market structure is relatively concentrated (HHI of 4,248)
- Proliance Surgeons, a large, physician-owned surgical practice, dominates the King orthopedics market. Proliance receives 47.5% of referrals and charges 63% of total procedure value
Referral data
Patient referrals are the financial lifeblood of American healthcare organizations. Understanding the referral networks within which organizations are situated is key to healthcare executives making the right decisions on facility investment, physician acquisition and market entry. Analysis of referral data can help support these important decisions by providing insight into untapped sources of referrals, patient leakage, trends in the referral shares of different types of medical facilities and specialties, as well as by identifying central figures or facilities in referral networks.
Using CMS Medicare FFS claims data (compiled into a commercially available patient sharing graph dataset by CareSet) combined with other publicly available CMS datasets we conducted a comparative analysis of the referral networks of orthopedic surgeons in King County (the area around Seattle, WA) and Miami-Dade County[2] We assessed:
- Structural differences in the orthopedics market of Miami and King County
- Patient sharing relationships between organizations with orthopedic surgeons
- Competition between independent practices and systems
There are three important caveats of the data we worked with. Technically the dataset measures patient-sharing rather than explicit referrals. In spite of this, a large-scale physician survey administered by Harvard[3] has shown that patient-sharing relationships as measured by claim data are an accurate predictor of referral relationships between physicians. Also, this is a Medicare fee-for-service dataset, so conclusions are somewhat specific to this market. Finally, provider pairs sharing less than 11 patients are not included due to CMS privacy policies. Despite these caveats the referral data is a powerful tool for producing a high-level understanding of referral relationships between organizations and also for looking at very specific physicians.
Two well matched markets with contrasting orthopedics structures
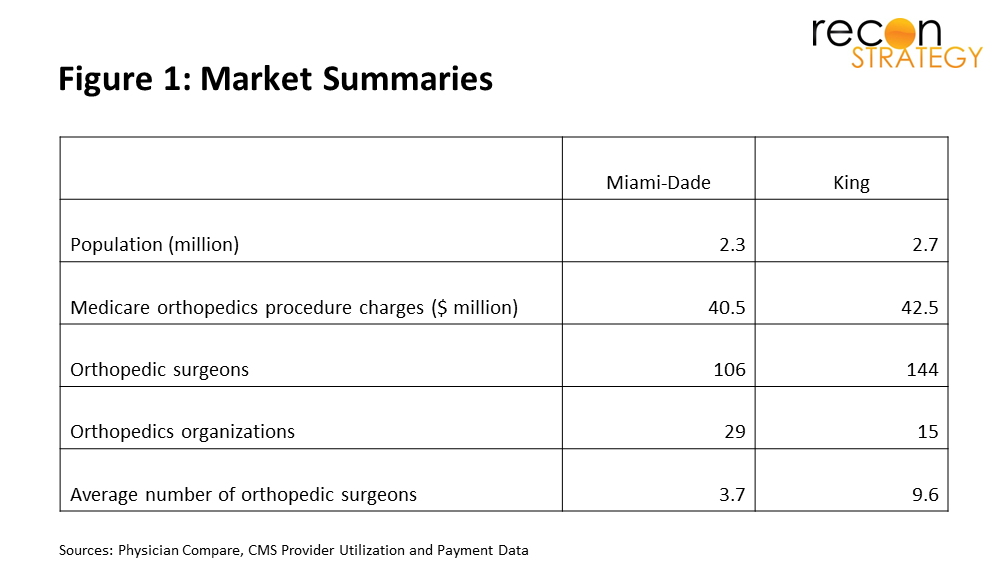
Miami and King County are well matched in terms of population and overall Medicare orthopedics procedure value (Figure 1) however we observed major differences in the structure of their orthopedics market. In King County, orthopedics is dominated by a group of independent physicians, Proliance Surgeons, who contract 52% of the orthopedic surgeons and charges 63% of total procedure value. The Miami market is much more fragmented with more than double the number of organizations and a much lower market concentration of orthopedics procedure charges (HHI of 1,049 vs 4,248 in King). Differences in average group size were driven from both ends of the market; in Miami, we found 17 surgeons operating independently compared with 0 in King County.
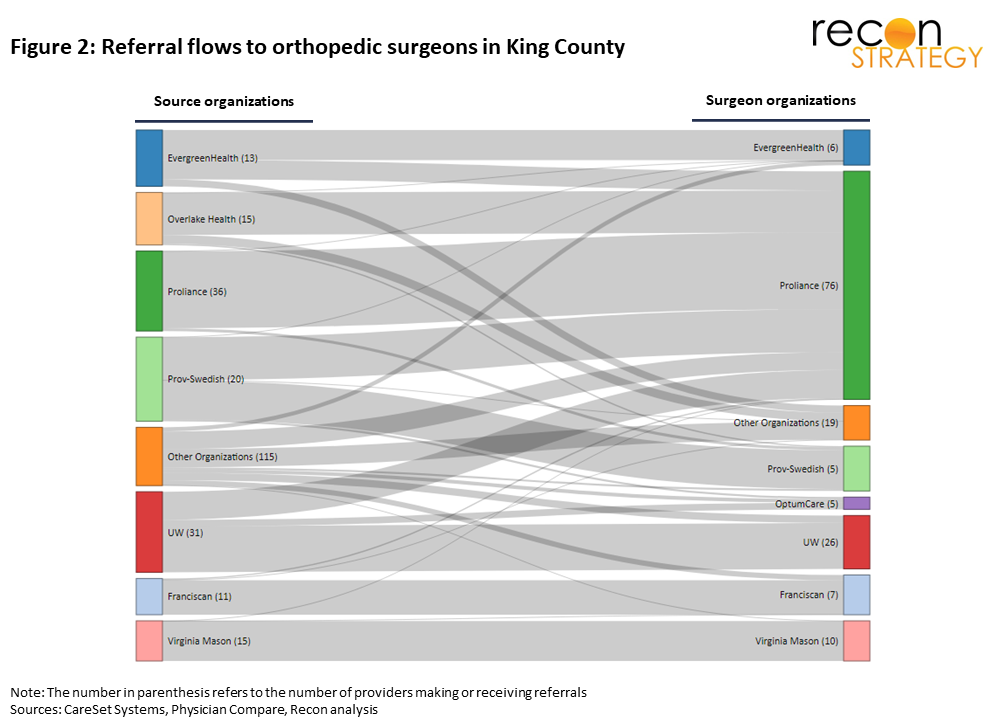
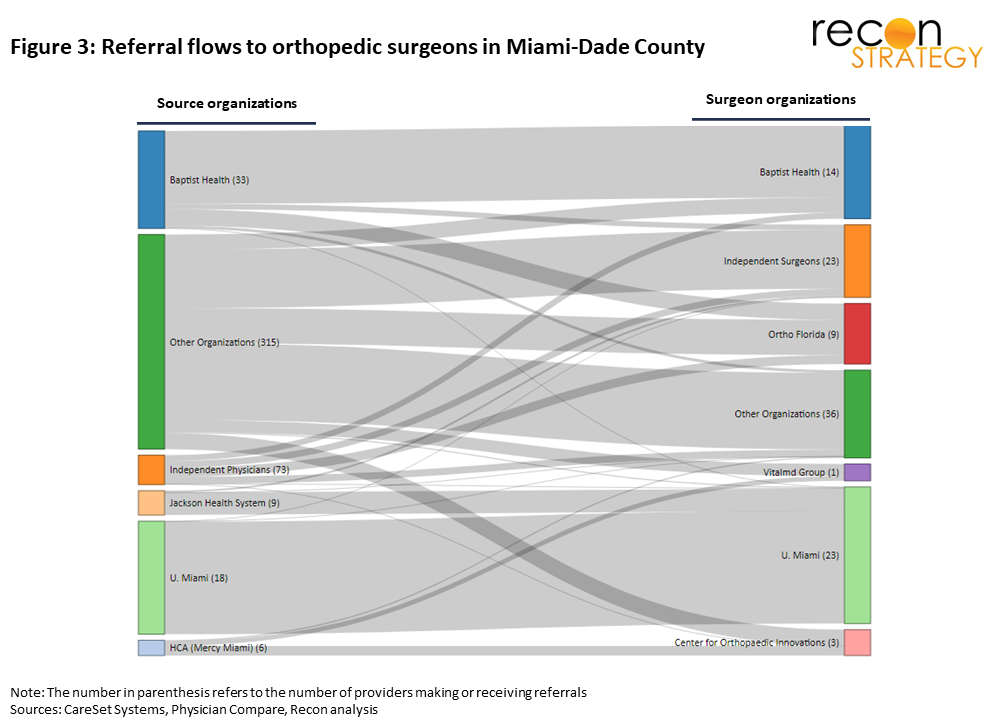
To visualize referral flows between PCP organizations and organizations with orthopedic surgeons, we use Sankey diagrams (presented in Figure 2 and 3) with referring physicians on the left and orthopods on the right. The width of the lines flowing between organizations is proportional to the number of patient referrals from PCPs to surgeons. When interpreting the diagrams, it is important to keep in mind that they show partnerships between organizations as well as patient leakage. Affiliated partnerships we have identified using qualitative evidence are Providence-Swedish and Overlake with Proliance in King County and Jackson Health with U. Miami in Miami.
The Sankey diagrams illustrate three key insights into the similarities and differences between the King County and Miami orthopedics markets:
1. Miami’s orthopedics referral base is highly fragmented compared with that of King County. 237 small “other organizations” and independent physicians make the majority of referrals to orthopedics. In King County, the bulk of referrals come from PCPs affiliated with big systems and independent physicians hardly feature as they make just 1% of referrals. King’s “other organizations” bucket is made up of just 77 organizations. The fragmented referral base in Miami may support the numerous small orthopedics groups by providing unaffiliated sources of patients.
2. Independent surgeons operating in Miami receive a significant proportion of patient referrals (18%) mainly from small organizations and other independent physicians. No comparable independent/small group PCP to independent surgeon ecosystem exists in King County.
3. In both markets, bigger systems are generally better at holding on to referrals internally or with affiliated partners.
The Proliance model
So how does Proliance, a group of independent physicians with a relatively small internal referral base, dominate a market with several big system orthopedic practices? Our analysis of referral data (summarized in Figure 2) shows that Proliance’s orthopedics referrals come from three approximately equally sized segments; internal referrals from Proliance physios, patient leakage from non-affiliated organizations and referrals from partner organizations.
Internal Referrals
Proliance’s 36 physical medicine providers form a loyal internal referral base for its orthopedic surgeons providing 33% of their referrals.
Partnerships
Overlake and Prov-Swedish, two big system players who have “made their peace” with Proliance refer 37% of Proliance’s patients. In both cases this partner relationship is manifest in shared facilities: Prov-Swedish operates ASCs jointly with Proliance[4] and Overlake’s Medical Center hosts a large part of the Proliance practice[5]. Low wait times for referred patients (2-4 days between these two partners and Proliance compared with the market average of 10 days) also indicate well-honed service models you would expect to see between partnered practices.
Patient leakage
Leakage from non-partnered organizations accounts for 30% of Proliance’s referrals. UW supplies 12.5%, EvergreenHealth 8.5% and another 50 smaller organizations provide the remaining 8.5%. Interestingly, Proliance appears to be better able to attract patient referrals from competing big systems on the Eastside of King County than in downtown Seattle. Patient leakage to Proliance from UW, EvergreenHealth and Providence-Swedish was 42% on the Eastside compared with 30% in downtown Seattle.
Since the referral data is published at the provider level, it is possible to present summaries of the patient leakage to individual Proliance orthopedic surgeons as well to other surgeons. What you will find when exploring the physician profiles (Figure 4) is that generally Proliance surgeons, including the default Dr. Christopher Boone, have a more diversified mix of referral sources than other surgeons.
Proliance soaking up ASC cases?
Our analysis of claims data showed that 22% of Proliance’s Medicare charges came from ASCs. This is a much higher proportion than other orthopedics organizations which processed only 2.5% of charges in ASCs. Referral data suggest that Proliance’s dominance of ASC orthopedics is an important magnet for patient leakage from the large orthopedics systems it competes with: 98% of patients leaking from UW, Franciscan and Virginia Mason goes to Proliance physicians whose primary practice address is an ASC. This indicates large hospital systems are passing on (less complex) cases to Proliance who are capitalizing from their near monopoly (>80% share of charges) on ASC orthopedics.
Conclusions
Our findings suggest some potential rules of thumb about market competition in orthopedics which could also be applicable to other specialties with high technical revenue potential:
- Fragmentation in the referral base enables fragmentation in the specialty market structure
- A consolidated referral base does not necessarily mean that systems can keep specialty referrals internal. Large specialty practices can effectively compete for referrals under certain conditions
- One of those conditions appears to be related to site of service arbitrage. Some systems may prefer to keep their workflows geared towards internal procedures and are willing to refer out procedures that are going to be done at novel, low risk settings
[1] “HHI” refers the Herfindahl–Hirschman Index, a commonly accepted measure of market concentration. The HHI is calculated by squaring the market share (% of Medicare procedure charges) of each group/independent physician and then summing the resulting numbers.
[2] CareSet’s “Hop” algorithm uses dated Medicare FFS (part A & B) claims to create a directed graph dataset which counts the number of times a patient switched from provider-to-provider. For more details see CareSet’s website. Supporting data on providers were drawn from Physician Compare, NPPES registry and CMS provider utilization data. We filtered out some patient-sharing relationships which were likely to be noise based on the specialty of the referral source and the time period for the bulk of patients being seen by the surgeon. We calculated an estimate of the time it took for the bulk of patients to be seen using a combination of the average and standard deviation of the day wait between a patient seeing providers. Cut-off values for this time period were based on a rigorous survey of appointment wait times for orthopedic surgeons in the two markets. To further minimize noise from patient-sharing relationships unlikely to be genuine referrals we applied a weighting to patient flows between providers where the data showed the bulk of patients were being seen significantly above standard wait times in the market.
[3] https://onlinelibrary.wiley.com/doi/abs/10.1111/j.1475-6773.2011.01262.x
[4] https://www.doh.wa.gov/Portals/1/Documents/2300/2016/CN15-25.pdf
[5] https://www.proliancesurgeons.com/locations/detail/52