
We refresh a prior analysis of two cohorts of oncology development programs: one with first-in-human (FIH) in 2012, and the other with FIH in 2017H2. We use a Kaplan-Meier approach to track whether programs have reached either of two final outcomes: a first approval from FDA, or a discontinuation of development. We find again that programs from commercial pharma reach final outcomes much faster than those from early-stage biotechs, which likely reflects a mix of a higher operational resourcing and efficiency, and more portfolio prioritization rigor. Beyond other specific findings, we show how Kaplan-Meier analyses might be a useful benchmarking tool for large pharmas and VC portfolios alike.
PDF version of this report is available here.
Introduction
In a previous report[1], we studied two cohorts of oncology development programs:
- 75 assets with FIH US trials initiated in 2012
- 76 assets with FIH US trials initiated in Q3/4 2017
In our analysis, we noted the increasing use of expansion cohorts in the initial studies as a replacement for phase 2 studies, and we also showed that commercial stage pharma was much quicker at progressing and discontinuing programs.
Since then, we’ve updated and expanded our original analysis as both cohorts have matured further. In particular, we deploy a Kaplan-Meier approach – a ubiquitous tool of oncology – focusing not on subjects of a clinical study, but on programs themselves. Our unit of analysis is whether a program/asset has reached an endpoint in the form of a “final clinical and scientific conclusion”, i.e. it either has been abandoned, or it has succeeded in getting an (FDA) approval. Such an approach is intended to highlight potential variations in the operational efficiency in development and portfolio management processes.
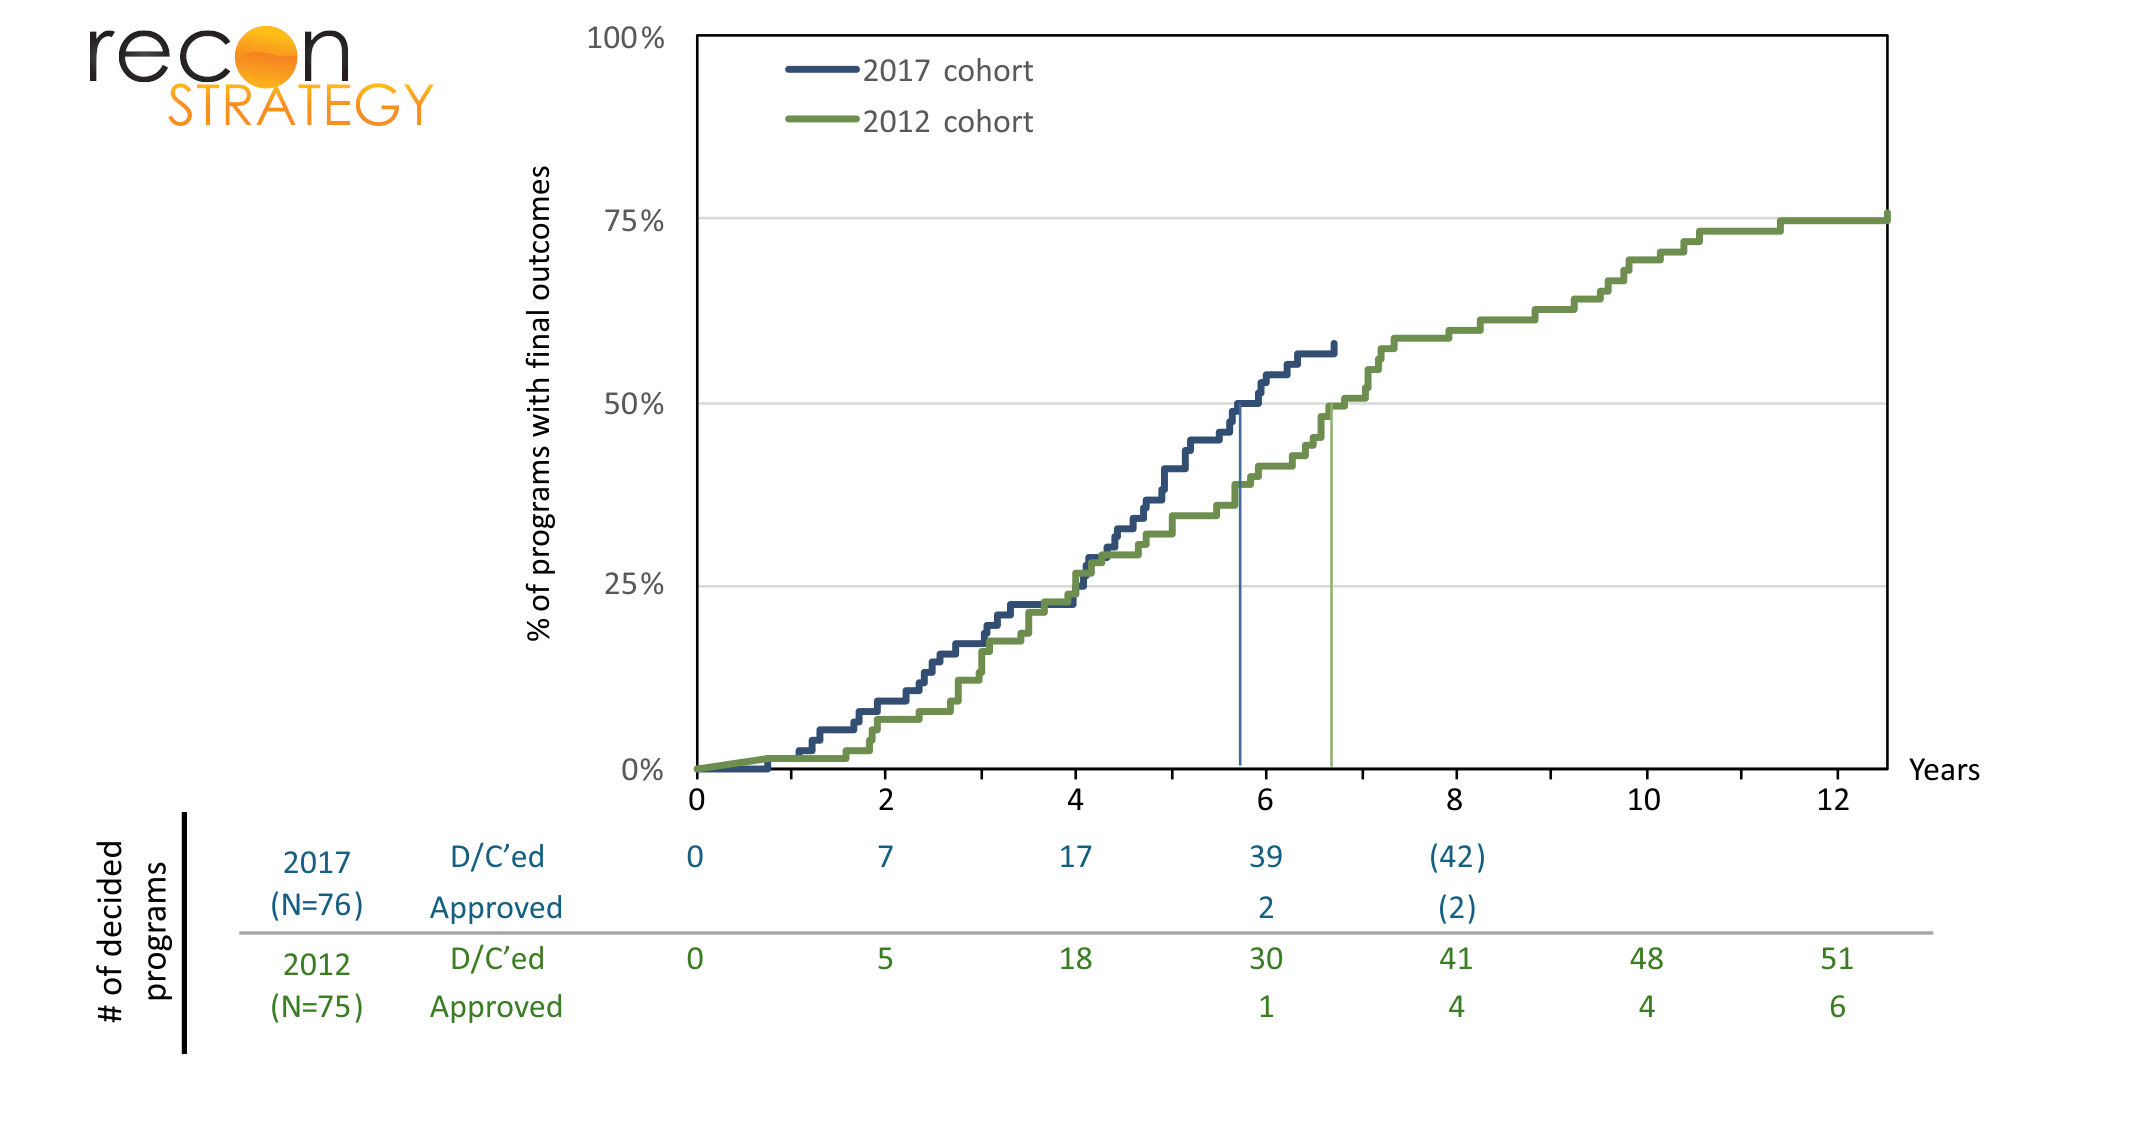
The 2017 cohort is maturing slightly faster than the 2012 cohort
Now in its 12th year, the 2012 cohort is relatively mature, with only 18 (24% of the original set of 75) assets still in development, and with 51 discontinuations and 6 approvals (PTRS~10%, to be determined more precisely by the fate of the remaining programs). As expected, the 2017 cohort is far less mature and has barely passed the median with 42% of assets still in development, and 2 approvals so far.
Exhibit 1 shows an (inverted) Kaplan-Meier graph of the proportion of programs still in (pre-approval) development over time. The median time in development for the 2012 cohort was 6.83 years (95% CI 5.83 – 9.25), and for the 2017 cohort, it was 5.81 years (95% CI 4.92 – NA), a difference of a year that just reaches statistical significance[2]. As we will see below, this change was mostly due to an acceleration of outcomes from programs from early-stage biotechs.
The strongest predictor of speed to outcome is the type of sponsor
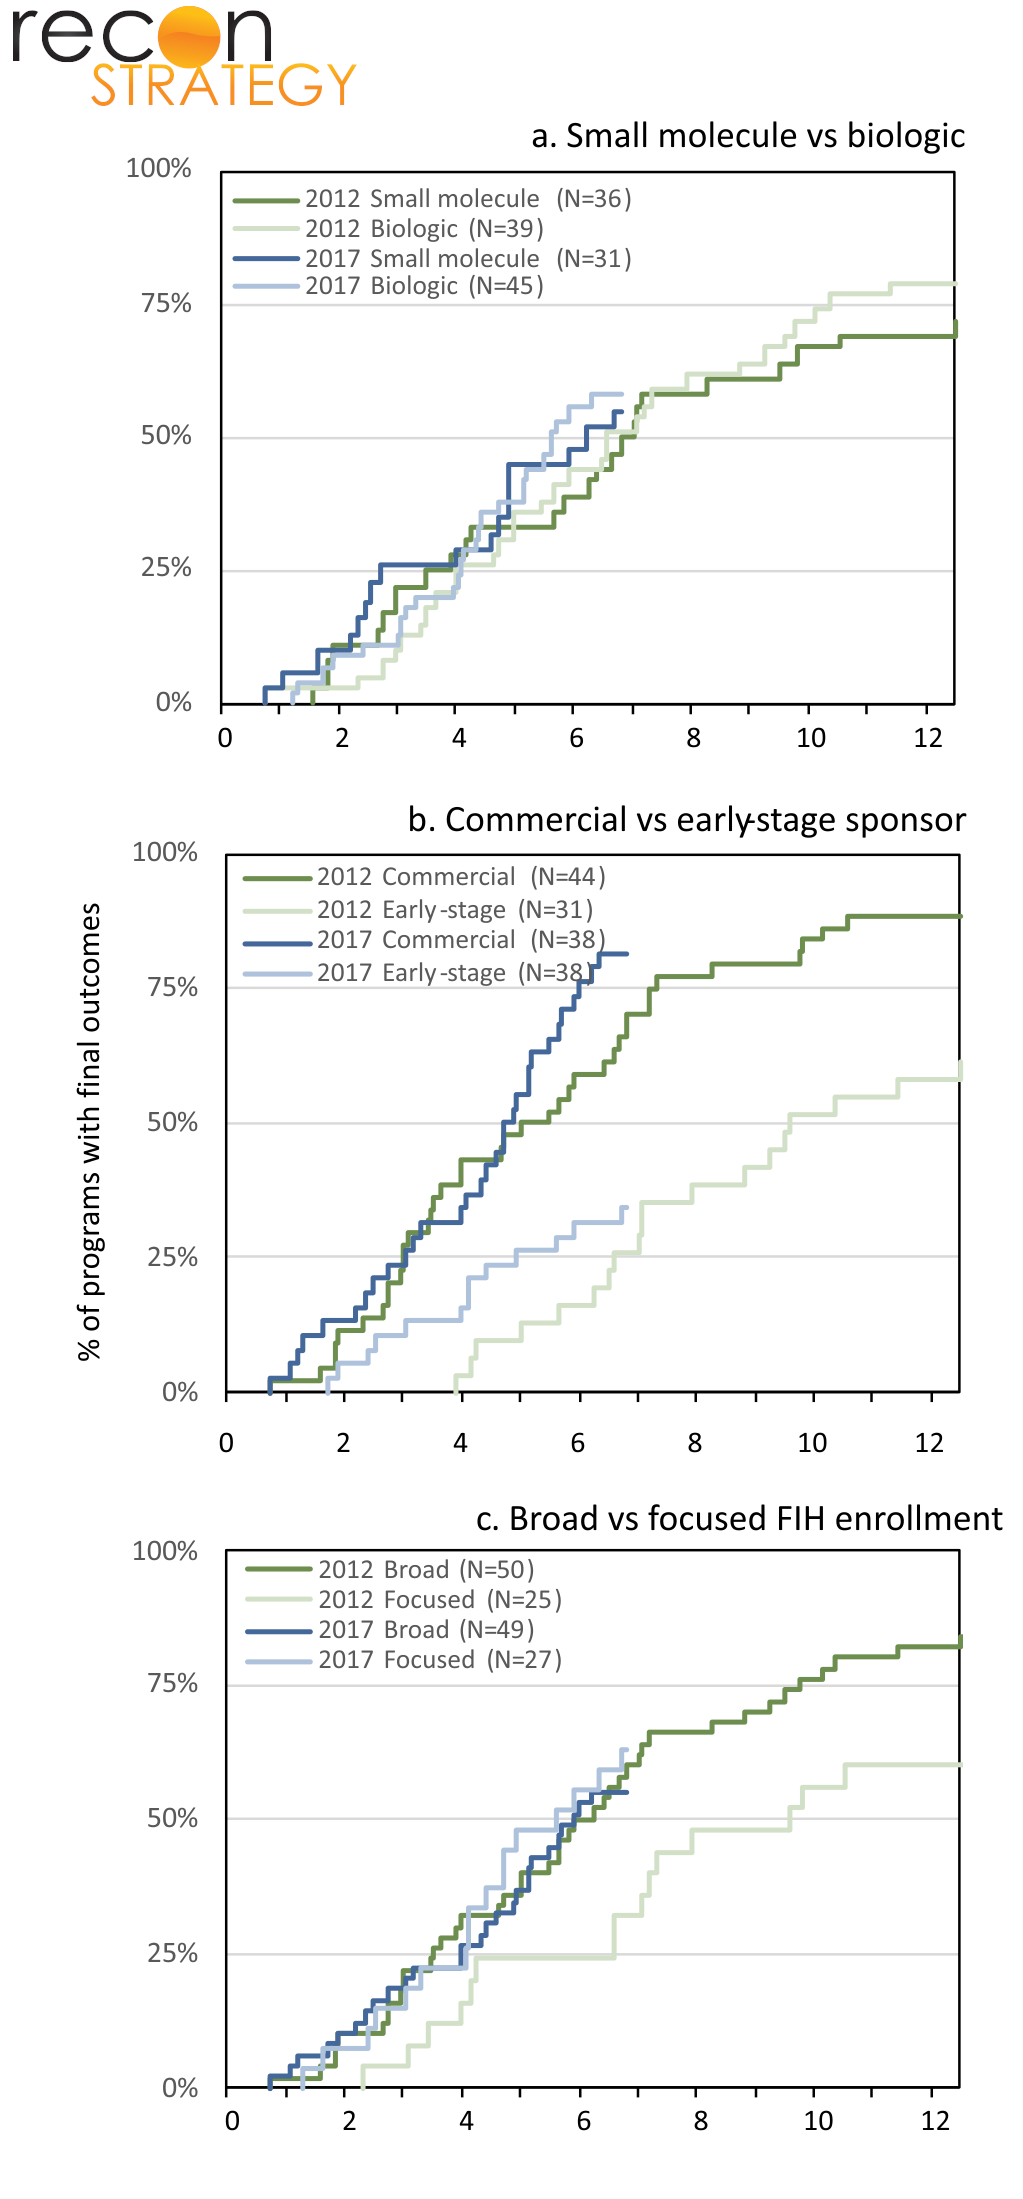
We further investigated whether asset characteristics[3] (small molecule vs biologic), sponsor type (commercial vs early-stage), or strategy for FIH enrollment (broad vs focused) affect rates at which programs reach their final outcomes.
As seen in Exhibit 2a, small molecules and biologics have similar rates of progression to final outcome in both the 2012 and 2017 cohorts.
Exhibit 2b confirms findings from our previous analysis: commercial sponsors discontinue programs significantly faster than their early-stage counterparts. In both the 2012 and 2017 cohorts, assets sponsored by commercial-stage biopharmas are reaching their final outcome considerably faster than assets sponsored by early-stage biotechs.[4] In addition, it shows that the difference between 2012 and 2017 overall was due to the programs from early-stage biotechs getting discontinued faster within the first few years (and notably, this happened before the biotech funding pull back of 2022).
Finally, exhibit 2c shows the impact of early trial strategy by differentiating between those programs that begin with broad enrollment criteria (e.g. general advanced solid tumors from a range of organs) versus focused enrollment criteria (patients with specific tissue types / mutations). In the 2012 cohort, assets with a focused initial enrollment strategy were discontinued more slowly (also approved more slowly, with 5 approvals in the broad group versus 1 in the focused group). Interestingly, that difference vanished in the 2017 cohort.
To further investigate this relationship, we subdivided the broad vs focused cohorts based on the type of sponsor. Exhibit 3 demonstrates that in both 2012 and 2017, commercial-stage sponsors discontinued programs with a broad FIH strategy faster than those with a focused clinical strategy from the start. One could interpret this from a Bayesian perspective: when there is a specifically targeted biological mechanism that drives the program, the prior that it “ought to work” is pretty significant, whereas when it’s a general purpose cell killing mechanism (e.g. targeting housekeeping genes) the priors are less significant and get overridden more easily by empirical findings in the clinic.
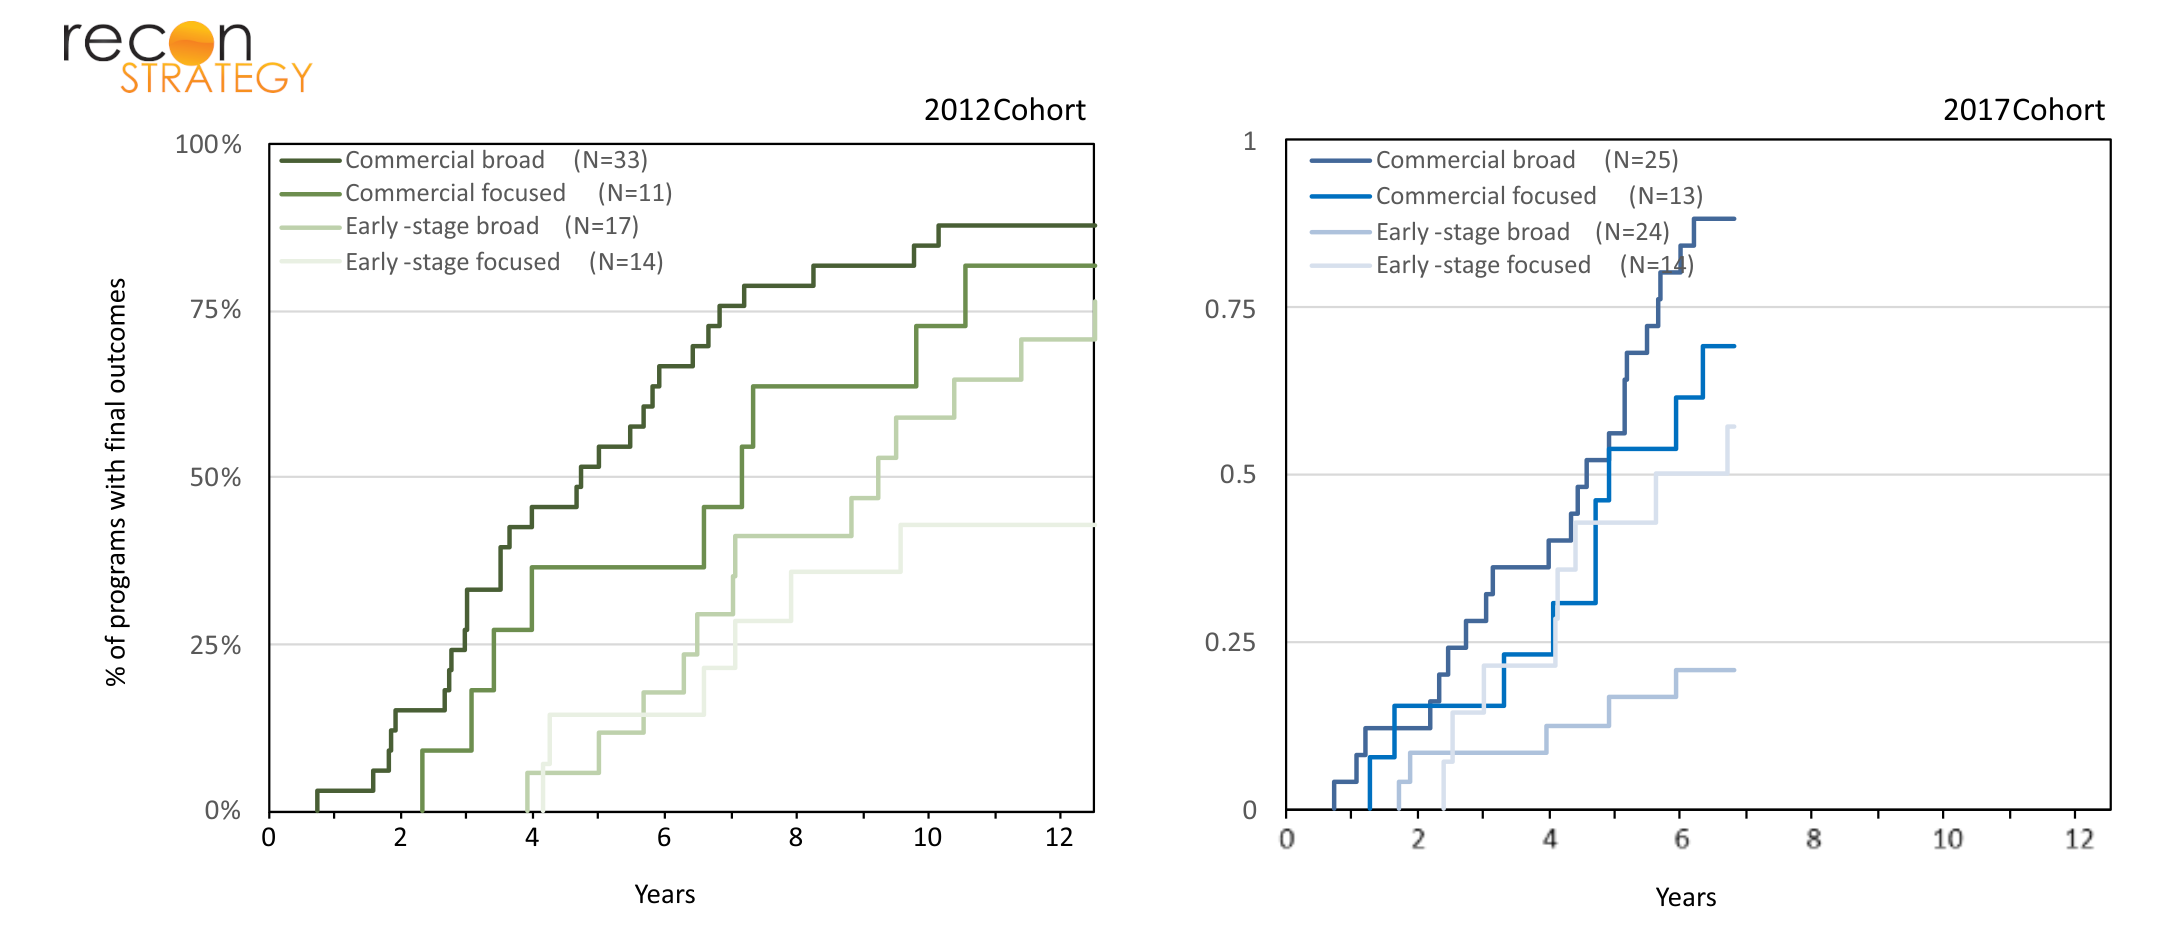
However, while the same holds for programs originating from early-stage biotechs in the 2012 cohort, the relationship is unexpectedly reversed in 2017, with assets pursuing focused strategy terminating earlier than those with a broader FIH strategy. We do not have a good explanation for this. This would likely require a program by program deep-dive and analysis to find out for instance, if those programs have been increasingly leveraging biomarkers of target engagement.
Limitations and final thoughts
Our findings come with limitations. First, the 2017 cohort has only spent 7 years in the clinic and has barely passed the median for programs with a final outcome; it may be that future events in that cohort will change the outlook. Second, the once-in-a-lifetime operational disruption of clinical programs by Covid in 2020/2021 and the subsequent major funding retrenchment that occurred in biopharma in 2022 may have changed findings from what is more typically expected. Third, we did not individually collect reasons for discontinuation by program – more saliency might be extracted by tracking whether a program was discontinued for business purposes or due to clinical underperformance – not infrequently, it is a mix of both.
This said, we believe the information surfaced by a Kaplan-Meier analysis of oncology program statuses overall may be similarly useful as it has been for the analysis of individual oncology studies. How does a portfolio of programs (either from a large pharmaceutical or a VC) stack up in terms of rate of maturation? Once a commitment has been made to push an asset into clinical testing, a speedy arrival at a “yay” or “nay” answer is essential – Kaplan-Meier analyses can help assess that.
[1] Trends and strategy in oncology development, Zhang, Brauner, & Herant. 2023
[2] Analysis performed with version 4.4.0 of R using the survival package
[3] In situations where control of an asset changed hands, the sponsor type is defined by who ran the FIH study
[4] In the 2012 cohort, of the 6 assets that have reached approvals, 3 were from commercial stage sponsors and 3 were from early-stage biotechs